Introduction
Since the hair root is vascularized during its growth, illicit drugs present in the blood stream may enter the hair shaft via the root where they will be sequestered. Therefore, the use of illicit drugs can be revealed by analyzing a small hair sample. To increase the analysis throughput of hair samples, the Luxon Ion Source® coupled to tandem mass spectrometry (MS/MS) was used for the identification and quantification of drugs of abuse.
For this project, we propose to perform a generic extraction method for illicit drug analysis in hair. Screening using the Luxon coupled to a mass spectrometer (Luxon-MS/MS) is chosen as a fast-analytical technique.
Luxon Ionization Source
The Luxon Ion Source® (Figure 1) is the second-generation sample introduction and ionization source based on the LDTD® technology for mass spectrometry. Luxon Ion Source® uses Fiber-Coupled Laser Diode (Figure 2) to obtain unmatchable thermal uniformity giving more precision, accuracy and speed. The process begins with dry samples which are rapidly evaporated using indirect heat. The thermally desorbed neutral molecules are carried into a corona discharge region. High efficiency protonation and strong resistance to ionic suppression characterize this type of ionization and is the result of the absence of solvent and mobile phase. This thermal desorption process yields high intensity molecular ion signal in less than 1 second sample to sample and allows working with very small volumes.
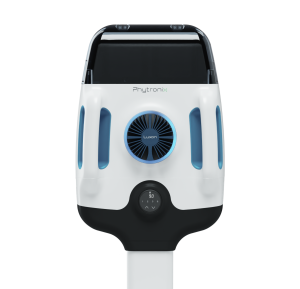
Figure 1 – Luxon Ion Source®
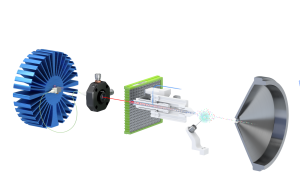
Figure 2 – Schematic of the Luxon Ionization Source
Sample Preparation Method
A pre-wash of the hair is performed to remove external contaminants using Methanol. 10 mg of hair cut into small pieces are transferred in a vial.
2 mL of methanol containing TFA at 0.5% (with internal standard) is added and samples are soaked at 60 degrees Celsius for 1h45. Samples are then sonicated for 15 minutes.
After the extraction, 500 µL of sample are mixed with 200 µL of a solution of KH2PO4 (1 mM) / BSA (100 µg/mL) in water.
8 μL of the extract are spotted into 96-LazWell™ plates and evaporated to dryness at 40 degrees Celsius for 8 minutes. Luxon-MS/MS analysis is done after a complete evaporation.
LDTD-MS/MS Parameters
LDTD
Model: Phytronix, Luxon S-960
Carrier gas: 6 L/min (air)
Laser pattern: 3 second ramp to 55% power and hold 2 seconds
MS/MS
Model: Q-Trap System® 5500, Sciex
Ionization: APCI
| Drugs | Transition | CE |
|---|---|---|
| Amphetamine | 136 → 119 | 12 |
| Amphetamine-D11 | 147 → 98 | 27 |
| Methamphetamine | 150 → 119 | 15 |
| Methamphetamine-D11 | 161 → 97 | 27 |
| MDA | 180 → 163 | 20 |
| MDMA | 194 → 163 | 12 |
| MDMA-D5 | 199 → 165 | 12 |
| MDEA | 208 → 163 | 12 |
| Diethylpropion | 206 → 100 | 35 |
| Diethylpropion-D10 | 216 → 110 | 35 |
| Mazindol | 285 → 242 | 35 |
| Mazindol-D4 | 289 → 242 | 35 |
| Morphine | 286 → 152 | 75 |
| Morphine-D6 | 292 → 152 | 75 |
| Codeine | 300 → 152 | 75 |
| Codeine-D6 | 306 → 152 | 75 |
| Cocaine | 304 → 182 | 25 |
| Cocaine-D3 | 307 → 185 | 25 |
| 6-Monoacetylmorphine | 328 → 165 | 50 |
| 6-Monoacetylmorphine-D6 | 334 → 165 | 50 |
| Drugs | Transition | CE |
|---|---|---|
| THC | 313 → 245 | -35 |
| THC-D3 | 316 → 248 | -35 |
Results and Discussion
Precision
Spiked samples around the decision point and blank solutions are used to validate the precision of the method. Each concentration must not exceed 20% CV and the mean concentration ± 2 times the standard deviation must not overlap with other concentrations at the decision point. The peak area against IS ratio was used to normalize the signal. Replicate extractions are deposited on a LazWell™ plate and dried before analysis. No overlapping at the decision point is observed for all curves and the CV% was below 15% for within-run experiments. Results using the ± 2 STD overlay are plotted. Figure 3 shows the results of the within-run test for amphetamine. Similar results are obtained for the other drugs.
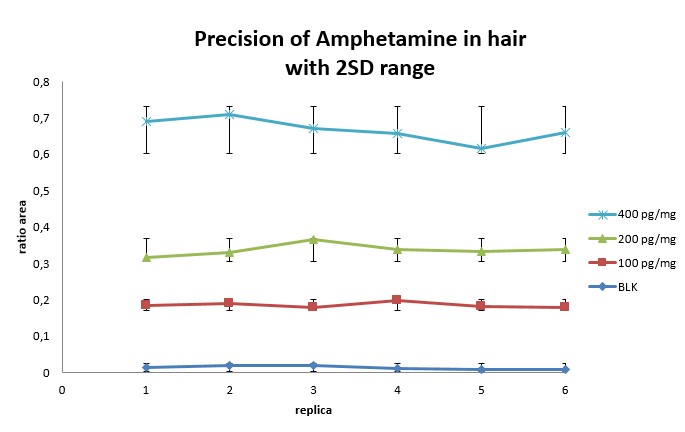
Figure 3 – Within run Precision curves for Amphetamine
For the inter-run precision experiment, each fortified sample sets are analyzed in triplicate on five different days. Table 3 shows the inter-run precision results.
| Grand mean (pg/mg) |
Grand mean – 2SD |
Grand mean + 2SD |
Grand mean (pg/mg) |
Grand mean – 2SD |
Grand mean + 2SD |
||
|---|---|---|---|---|---|---|---|
| Amphetamine (pg/mg) | Codeine (pg/mg) | ||||||
| 100 | 102.2 | 90.9 | 113.5 | 100 | 101.7 | 82.9 | 120.4 |
| 200 | 198.0 | 170.3 | 225.7 | 200 | 196.8 | 170.1 | 223.5 |
| 400 | 390.7 | 351.8 | 429.7 | 400 | 397.9 | 348.3 | 447.5 |
| Methamphetamine (pg/mg) | Cocaine (pg/mg) | ||||||
| 100 | 104.8 | 96.9 | 112.7 | 250 | 261.5 | 228.0 | 295.1 |
| 200 | 193.9 | 172.5 | 215.3 | 500 | 492.9 | 457.9 | 527.8 |
| 400 | 384.7 | 362.1 | 407.3 | 1000 | 960.4 | 856.9 | 1063.9 |
| MDA (pg/mg) | THC (pg/mg) | ||||||
| 100 | 105.3 | 84.0 | 126.5 | 25 | 22.7 | 14.8 | 30.6 |
| 200 | 192.8 | 161.5 | 224.0 | 50 | 52.1 | 45.3 | 58.9 |
| 400 | 390.1 | 342.5 | 437.8 | 100 | 103.6 | 90.3 | 116.8 |
| MDMA (pg/mg) | 6-MAM (pg/mg) | ||||||
| 100 | 103.3 | 89.9 | 116.7 | 100 | 103.3 | 93.9 | 112.8 |
| 200 | 196.4 | 179.8 | 212.9 | 200 | 200.9 | 183.3 | 218.6 |
| 400 | 389.2 | 361.1 | 417.3 | 400 | 378.0 | 337.2 | 418.8 |
| MDEA (pg/mg) | Diethylpropion (pg/mg) | ||||||
| 100 | 102.8 | 87.4 | 118.2 | 100 | 101.8 | 77.3 | 126.4 |
| 200 | 200.6 | 161.0 | 240.2 | 200 | 196.7 | 168.3 | 225.1 |
| 400 | 386.9 | 361.4 | 412.3 | 400 | 413.2 | 341.6 | 484.8 |
| Morphine (pg/mg) | Mazindol (pg/mg) | ||||||
| 100 | 103.4 | 80.3 | 126.5 | 100 | 94,0 | 78,5 | 109,4 |
| 200 | 203.7 | 151.3 | 256.1 | 200 | 226,9 | 163,7 | 290,2 |
| 400 | 374.3 | 296.0 | 452.5 | 400 | 397,6 | 362,6 | 432,7 |
Wet stability of sample extracts
Following the extraction, sample extracts are kept at 4°C in closed containers. After 4 days, sample extracts were spotted on a LazWell™ plate and analyzed. Precision at 50% cut-off standard is reported in Table 4 for Amphetamine. All the results are within the acceptable range (criteria %CV ≤20%) for 4 days at 4°C. Similar results are obtained for the other drugs.
Dry Stability of Samples Spotted in LazWell™
Extracted samples are spotted onto a LazWell™ plate and kept at room temperature before analysis. Precision at 50% cut-off standard is reported in Table 4 for Amphetamine. All the results are within the acceptable range (criteria %CV ≤20%) for 2 hours at room temperature. Similar results are obtained for the other drugs.
| Parameters | Dry stability | Wet stability |
|---|---|---|
| Time | 2 hours | 4 days |
| Temp. (°C) | 22 | 4 |
| Conc. (pg/mg) | 100 | 100 |
| N | 6 | 6 |
| Mean (pg/mg) | 101.4 | 102.1 |
| %CV | 3.6 | 3.9 |
Luxon-MS/MS: Sample screen
Sample specimens are extracted and analyzed using a Luxon-MS/MS method. After a fast desorption, specimens, fortified and blank samples are evaluated using peak area ratio. All samples having a concentration higher than the cut-off standard are classified as drug positive samples. Table 5 shows the screening and confirmation results of the samples. All samples are analyzed using LC-MS/MS confirmation method for cross validation. No false positives or false negatives are observed using the Luxon-MS/MS screening method.
Conclusion
Luxon Ion Source® combined to Q-Trap 5500 mass spectrometer system allows ultra-fast (8 seconds per sample) screening of drugs in Hair sample using a generic sample preparation.
Table 5 – Sample screen and confirmation results
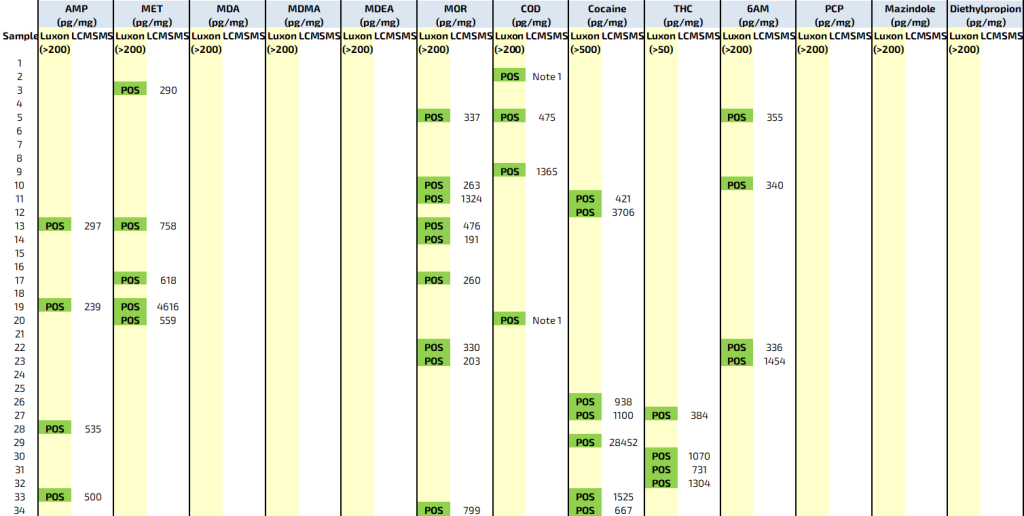
Note: High concentrations of Hydrocodone (Codeine isobar drug) are detected in that sample by the confirmation method.