Introduction
Busulfan (Bu) is an alkylating agent commonly used in patients being prepared for hematopoietic stem cell transplantation (HSCT) for various types of hematologic malignancies such as acute myeloid leukemia (AML) and myelodysplastic syndrome (MDS) in addition to non-malignancies (thalassemia)1,2. In the clinical doses, Bu is considered as a potent cytotoxic drug which causes severe and prolonged myelosuppression.
Our goal for this application note is to develop a diagnostic tool to rapidly go through a quantification of Busulfan in plasmas, which will allow a rapid diagnosis.
LDTD®-MS/MS offers specificity combined with an ultra-fast analysis for an unrivaled quantification method. To develop this application, we focused on performing an efficient sample preparation, which will increase the speed of the analysis process and confirm diagnoses more quickly.
Sample Preparation Method
Stock solutions of Busulfan was prepared in acetonitrile at 1 mg/mL. Then, negative EDTA-K2 plasmas were spiked to generate a calibration curve and QCs.
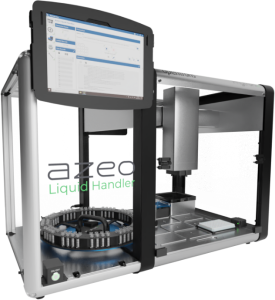
Automated Sample Extraction
An automated system (Figure 3) is used to extract the samples using the following conditions:
- 100 µL of Internal standard in methanol:Water (10:90)
- 50 µL of Sample
- Vortex
- 400 µL of Acetonitrile
- Vortex and Centrifuge (3000 rpm/4 min.)
- Spot 5 µL of upper layer on a LazWell™96 plate
- Dry 4 minutes at 40°C
LDTD®-MS/MS Parameters
LDTD
Model: Luxon S-960, Phytronix
Carrier gas: 9.0 L/min (air)
Laser pattern: 3-second ramp to 45% power
MS/MS
MS model: QTrap® System 5500, Sciex
IonSpray Voltage: 5500
Temperature: GS1 and GS2 set to zero.
CUR: 30
Scan Time: 20 msec
Analysis Method: Positive MRM mode
| Transition | CE (V) | |
|---|---|---|
| Busulfan-Quan | 247.0 → 55.0 | 22 |
| Busulfan-d8-Quan | 255.0 → 62.0 | 22 |
| Busulfan-Qual | 247.0 → 151.0 | 11 |
| Busulfan-d8-Qual | 273.0 → 147.0 | 11 |
Results and Discussion
Validation Test
Calibration curves ranging from 25 to 2000 ng/mL were prepared in negative EDTA-K2 plasmas. A set of QCs were prepared in the same matrix. Replicate extractions were deposited onto a LazWell™ plate and dried before analysis. The peak area against the internal standard (IS) ratio was used to normalize the signal.
Linearity
The calibration curves were plotted using the peak area ratio and the nominal concentration of standards. For the linearity test, the following acceptance criteria was used:
- Linear regression (r) must be ≥ 0.995
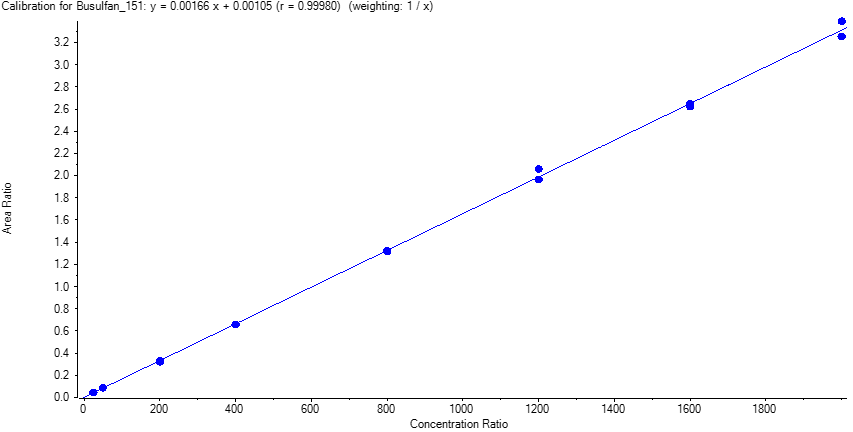
Table 2 shows the inter-day correlation coefficients for Busulfan (Quan and Qual transition). Values greater than 0.995 are obtained. Figure 4 shows a typical calibration curve result for Busulfan-Quan.
| Busulfan-Quan | Busulfan-Qual | |
|---|---|---|
| Curve 1 | 0.99909 | 0.99936 |
| Curve 2 | 0.99980 | 0.99979 |
| Curve 3 | 0.99957 | 0.99982 |
| Curve 4 | 0.99928 | 0.99979 |
| Curve 5 | 0.99985 | 0.99982 |
| Curve 6 | 0.99968 | 0.99976 |
Precision and Accuracy
For the accuracy and precision evaluation, the following acceptance criteria were used:
- Each concentration must not exceed 15% CV.
- Each concentration must be within 100 ± 15% of the nominal concentration.
For the intra and inter-run precision and accuracy experiment, each QC was analyzed in sextuplicate, on six different runs. Table 3 and 4 show the intra and inter-run precision and accuracy results for Busulfan-Quan. The obtained %CV was below 15% and the accuracy was within 15% of the nominal value. Similar results were obtained with the Busulfan-Qual transition.
| Busulfan-Quan | LLOQ | QC-L | QC-M | QC-H | ULOQ |
|---|---|---|---|---|---|
| Conc (ng/mL) | 25 | 75 | 1000 | 1500 | 2000 |
| N | 6 | 6 | 6 | 6 | 6 |
| Mean (ng/mL) | 28.1 | 76.2 | 987.4 | 1513.2 | 2060.8 |
| %CV | 4.7 | 1.4 | 2.4 | 0.8 | 1.9 |
| %Nom | 112.3 | 101.7 | 98.7 | 100.9 | 103.0 |
| Busulfan-Quan | QC-L | QC-M | QC-H |
|---|---|---|---|
| Conc (ng/mL) | 75 | 1000 | 1500 |
| N | 36 | 36 | 36 |
| Mean (ng/mL) | 76.8 | 980.6 | 1505.1 |
| %CV | 4.4 | 2.3 | 2.4 |
| %Nom | 102.4 | 98.1 | 100.3 |
Wet Stability of Sample Extracts
Following the extraction, sample extracts are kept at 4°C in closed containers. After 1 day, sample extracts are spotted on a LazWell™ plate, dried and analyzed. The precision and accuracy results of QCs are reported in Table 5. All the results are within the acceptable criteria range for 1 day at 4°C.
Dry Stability of Samples Spotted on LazWell™
Extracted samples are spotted onto a LazWell™ plate, dried and kept at room temperature for 1 hour before analysis. The precision and accuracy results of QCs are reported in Table 5. All the results are within the acceptable criteria range for 1 hour at room temperature.
| Parameters | Dry Stability (1 hour / RT) |
Wet Stability (1 day / 4°C) |
||||
|---|---|---|---|---|---|---|
| QC | QC-L | QC-M | QC-H | QC-L | QC-M | QC-H |
| Conc (ng/mL) | 75 | 1000 | 1500 | 75 | 1000 | 1500 |
| N | 4 | 4 | 4 | 4 | 4 | 4 |
| Mean (ng/mL) | 77.0 | 1003.9 | 1510.7 | 77.7 | 985.1 | 1483.2 |
| %CV | 2.4 | 1.2 | 1.9 | 1.4 | 1.6 | 2.3 |
| %Nom | 102.6 | 100.4 | 100.7 | 103.6 | 98.5 | 98.9 |
Matrix Effect Study
Eight different plasmas were spiked at QC-M level, extracted, and analysed. The precision and accuracy results of the different matrix spiked are reported in Table 6. All the results are within the acceptable criteria range.
| M1 | M2 | M3 | M4 | M5 | M6 | M7 | M8 | |
|---|---|---|---|---|---|---|---|---|
| Conc (ng/mL) | 1000 | 1000 | 1000 | 1000 | 1000 | 1000 | 1000 | 1000 |
| N | 3 | 3 | 3 | 3 | 3 | 3 | 3 | 3 |
| Mean (ng/mL) | 978.2 | 1007.9 | 1020.0 | 986.5 | 988.8 | 1044.0 | 1036.0 | 1031.0 |
| %CV | 0.9 | 1.7 | 1.4 | 0.9 | 0.8 | 1.0 | 1.8 | 3.4 |
| %Nom | 97.8 | 100.8 | 102.0 | 98.7 | 98.9 | 104.4 | 103.6 | 103.1 |
Conclusion
The Luxon Ion Source® combined with the Sciex QTrap® 5500 mass spectrometer system enables the rapid quantification of Busulfan in plasmas. This method of analysis can thus be applied at the clinical level in order to evaluate the concentration of Busulfan for a quick dosage adjustment.