Introduction
Impaired driving is a public health and safety concern. Toxicological testing is a critical part of these investigations. Academy standards board (ASB) published a guideline of the minimum requirements for target analytes and analytical sensitivity (ANSI/ASB standard 120, 1st Ed. 2021). Samples from these investigations are sent to crime labs, however, the analysis time per sample and the volume of requests creates delays. For forensic analysis laboratories, an improvement in the speed of sample analysis must be made. Indeed, in 2014, more than 500,000 samples were backlogged1.
Our goal for this application note is to use a simple sample preparation method and a fast analysis technique for drug screening in whole blood. Based on their chemical properties, two panels were used with a specific sample preparation.
The LDTD-MS/MS system offers specificity combined with an ultra-fast analysis for an unrivaled screening method. To develop this application, we focused on performing a simple sample preparation. Panel 1 was extracted using a Salt Assisted Liquid-Liquid Extraction (SALLE) approach and a Liquid-Liquid Extraction (LLE) was used for Panel 2. The drugs present in the first panel have a greater affinity for acetonitrile while the drugs present in the second panel have a greater affinity for MTBE. This is why the drugs under study have been divided into two panels according to their affinity with the extraction solvent.
Each panel was analyzed simultaneously with quantitative screening results obtained in less than 8 seconds per sample and specific cut-off values were attained for each drug.
Sample Preparation Method
Sample Collection
Whole blood samples were collected and transferred into barcoded tubes, readable by the Azeo Liquid Handler.

Sample Extraction (SALLE) : Panel 1
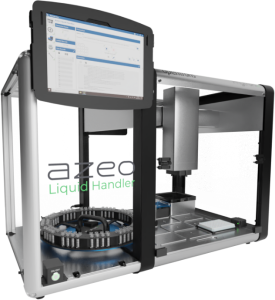
Each barcoded vial was scanned by the Azeo Liquid Handler and an automatic batch file was created. The Azeo extraction system (Figure 3) is used to extract the samples using the following conditions:
- 100 µL of whole blood sample
- 100 µL of Internal standard in Acetonitrile:Water (1:2)
- Vortex
- 200 µL of dilution solution (Acetonitrile: Water (1:1))
- Vortex
- 50 µL of ZnSO4 (1N)
- Vortex and centrifuge (5000 rpm / 2 min.)
- Mix 300 µL of upper layer, 300 µL of acetonitrile and 300 µL of buffer.
- Vortex and centrifuge (5000 rpm / 2 min.)
- Mix 90 µL of upper layer with 10 µL of desorption solution
- Spot 6 µL of mixture on a LazWell™96 plate
- Dry 3 minutes at 40°C
LDTD®-MS/MS Parameters
LDTD
Model: Luxon S-960, Phytronix
Carrier gas: 6.0 L/min (air)
Laser pattern:
- 6-second ramp to 85% power
- Hold 1 second at 85% power
MS/MS
MS model: QTrap® System 5500, Sciex
Ionization: APCI
Analysis Method: Positive MRM mode
| Drugs | Transition | CE |
|---|---|---|
| Methamphetamine | 150.1 → 119.1 | 15 |
| Methamphetamine-d5 | 155.1 → 121.1 | 15 |
| MDA | 180.1 → 133.1 | 20 |
| MDA-d5 | 185.1 → 138.1 | 20 |
| Tramadol | 264.2 → 58.2 | 50 |
| Oxazepam | 292.1 → 246.1 | 30 |
| Benzoylecgonine | 290.1 → 168.2 | 30 |
| Oxazepam-d5 | 292.1 → 246.1 | 30 |
| Benzoylecgonine-d3 | 293.1 → 171.1 | 30 |
| Temazepam | 301.1 → 255.1 | 25 |
| Temazepam-d5 | 306.1 → 260.1 | 25 |
| Methadone | 310.2 → 265.2 | 20 |
| Methadone-d9 | 319.3 → 268.2 | 20 |
| Lorazepam | 321.0 → 275.0 | 30 |
| Buprenorphine (-H2O) | 450.3 → 418.3 | 25 |
| Buprenorphine-d4 (-H2O) | 454.3 → 422.3 | 25 |
Sample Extraction (LLE): Panel 2
Each barcoded vial was scanned by the Azeo Liquid Handler and an automatic batch file was created. The Azeo extraction system (Figure 3) is used to extract the samples using the following conditions:
- 100 µL of whole blood sample
- 100 µL of Internal standard in Acetonitrile:Water (1:2)
- Vortex
- 1000 µL of Methyl tert-butyl ether (MTBE)
- Vortex and centrifuge (5000 rpm / 2 min.)
- 600 µL of upper layer were transferred to a new deep-well plate and evaporated to dryness.
- Add 100 µL of reconstitution solution.
- Vortex
- Spot 6 µL of mixture on a LazWell™96 plate
- Dry 4 minutes at 40°C
LDTD®-MS/MS Parameters
LDTD
Model: Luxon S-960, Phytronix
Carrier gas: 6.0 L/min (air)
Laser pattern:
- 6-second ramp to 65% power
- Hold 2 seconds at 65% power
MS/MS
MS model: QTrap® System 5500, Sciex
Ionization: APCI
Analysis Method: MRM mode
| Drugs | Transition | CE |
|---|---|---|
| Amphetamine | 136.1 → 119.1 | 12 |
| Amphetamine-d5 | 141.1 → 96.0 | 12 |
| MDMA | 194.1 → 133.0 | 25 |
| MDMA-d5 | 199.2 → 165.1 | 20 |
| Carisoprodol | 261.2 → 176.2 | 25 |
| Carisoprodol-d7 | 268.2 → 183.2 | 25 |
| Nordiazepam | 271.1 → 140.1 | 27 |
| Diazepam | 285.1 → 154.1 | 32 |
| Morphine/HYM/Norhydrocodone | 286.1 → 152.0 | 75 |
| Oxazepam-d5 | 292.1 → 246.1 | 40 |
| Morphine-d6 | 292.1 → 152.0 | 75 |
| Codeine/Hydrocodone | 300.2 → 152.0 | 75 |
| Temazepam-d5 | 306.1 → 260.1 | 40 |
| Codeine-d6 | 306.2 → 260.1 | 40 |
| Zolpidem | 308.1 → 236.1 | 35 |
| Alprazolam | 309.1 → 274.1 | 35 |
| Alprazolam-d5 | 314.1→ 286.1 | 45 |
| Clonazepam | 316.0 → 214.0 | 50 |
| Oxycodone | 316.2 → 241.0 | 35 |
| Oxycodone-d6 | 322.2 → 247.0 | 25 |
| Fentanyl | 337.2 → 188.1 | 25 |
| Fentanyl-d5 | 342.2 → 188.1 | 35 |
| Drugs | Transition | CE |
|---|---|---|
| THCC | 343.3 → 245.2 | -45 |
| THCC-d9 | 352.3 → 254.2 | -45 |
Results and Discussion
Initial Cut-Off Test (ng/mL)
A drug list and screening cut-offs requested by ANSI/ASB standard 120 guidelines can be found in Table 4.
| Analyte | Cut-off (ng/mL) | Analyte | Cut-off (ng/mL) |
|---|---|---|---|
| Carboxy-THC | 10 | Benzoylecgonine | 50 |
| Alprazolam | 10 | Fentanyl | 1 |
| Clonazepam | 15 | Codeine | 10 |
| Lorazepam | 15 | Hydrocodone | 10 |
| Diazepam | 50 | Morphine | 10 |
| Nordiazepam | 50 | Oxycodone | 10 |
| Oxazepam | 50 | Amphetamine | 20 |
| Temazepam | 50 | Methamphetamine | 20 |
| MDA | 25 | MDMA | 25 |
| Carisoprodol | 1000 | Zolpidem | 10 |
| Methadone | 50 | Buprenorphine | 1 |
| Tramadol | 100 | ||
Precision / Accuracy
Three-point screening curves and two QCs (QC-0.5X and QC-2X) were prepared in negative nail powder and used to validate the method. The peak area against the internal standard (IS) ratio was used to normalize the signal. Replicate extractions are deposited on a LazWell™ plate and dried before analysis.
The following acceptance criteria were used:
- Each standard concentration must not exceed 20% CV
- Each standard concentration must be ±20% of the nominal value (%Bias).
- QC-0.5X cut-off must be detected as negative.
- QC-2X cut-off must be detected as positive.
For the inter-run precision/accuracy experiment, each fortified sample set is analyzed in triplicate on five different days. Table 2 shows the inter-run precision and accuracy results. For temazepam, the %CV and %Bias was below 20%. All QC-0.5X were detected as negative and QC-2X detected as positive. Similar results are obtained for the other drugs in the panel.
| Temazepam | S1 | S2 | S3 |
|---|---|---|---|
| Conc (ng/mL) | 50 | 100 | 250 |
| N | 15 | 15 | 15 |
| Mean (ng/mL) | 50.3 | 99.2 | 250.5 |
| %CV | 8.0 | 7.8 | 7.2 |
| %Bias | 0.6 | -0.8 | 0.2 |
Wet Stability of Sample Extracts
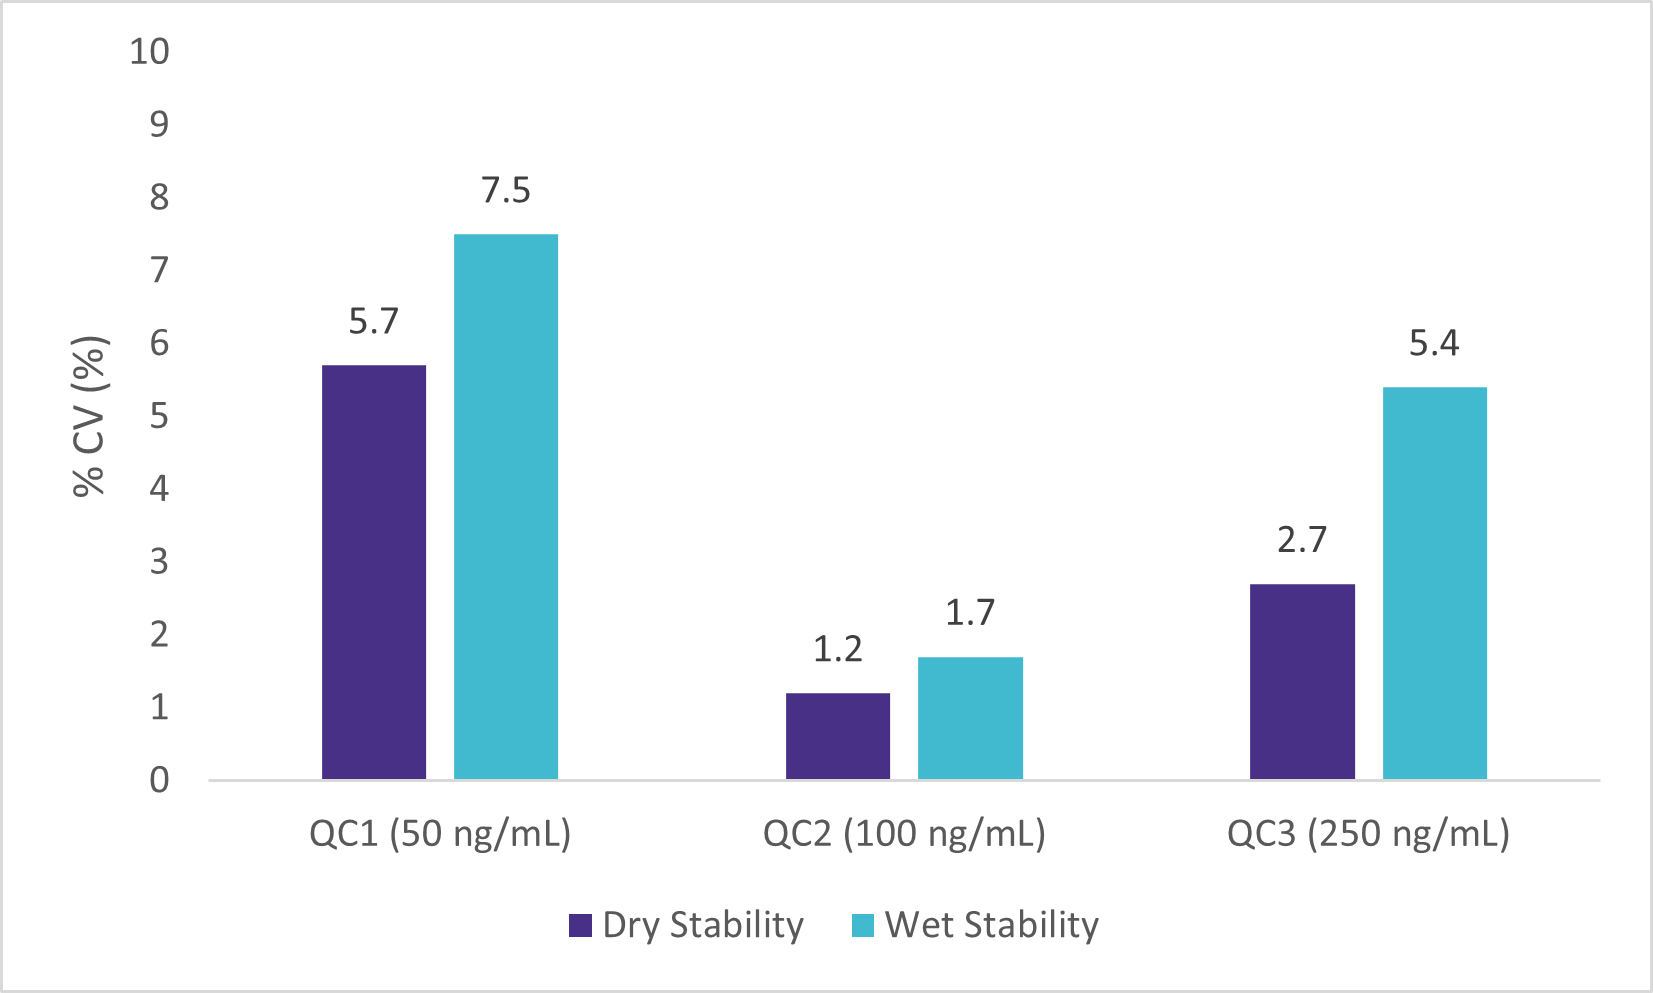
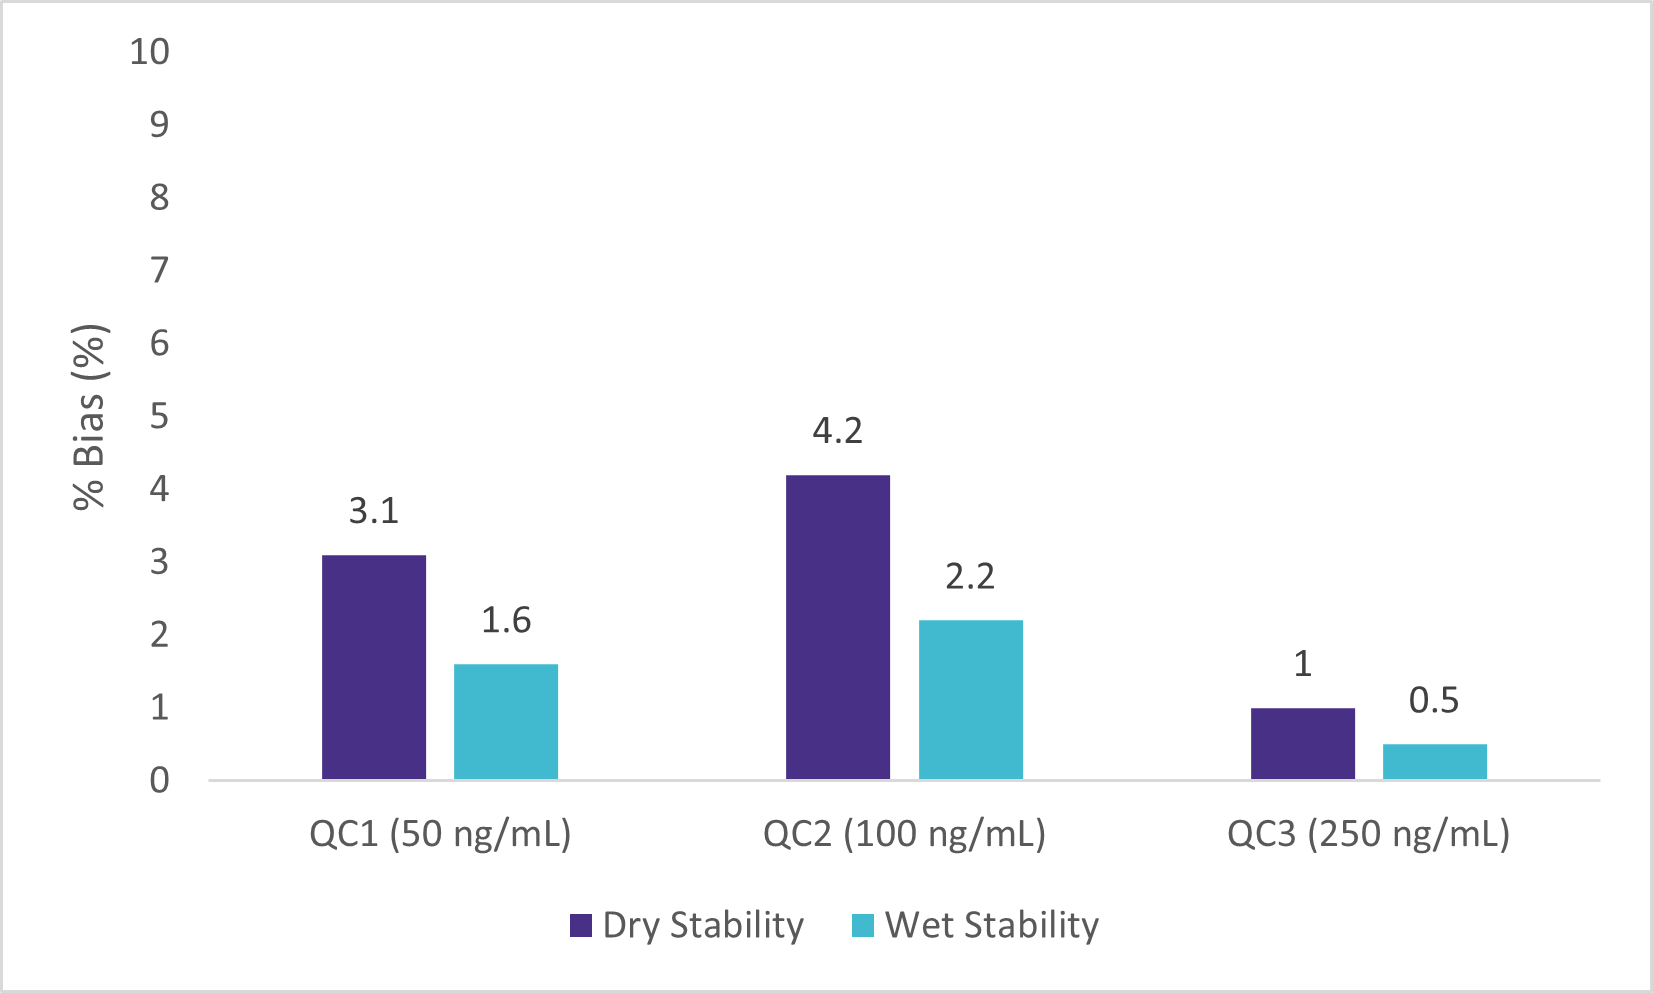
Following the extraction, sample extracts were kept at room temperature in closed containers. After 1 day, sample extracts were spotted on a LazWell™ plate, dried and analyzed. Precision and accuracy of standard are reported in Figure 4 and 5. All the results are within the acceptable criteria range for 1 day at room temperature.
Dry Stability of Samples Spotted on LazWell™
Extracted samples are spotted onto a LazWell™ plate, dried and kept at room temperature for 75 minutes before analysis. The precision and accuracy results of standard samples are reported in Figure 4 and 5. All the results are within the acceptable criteria range for 75 minutes at room temperature.


Blank Matrix Interference
Seven different blank matrices were extracted and analyzed to evaluate the drug signal. The following table (Table 6) presents the results of the blank matrix interference. Similar results are obtained for the other drugs.
| Buprenorphine | Lorazepam | MDA | |
|---|---|---|---|
| Matrix 1 | Negative | Negative | Negative |
| Matrix 2 | Negative | Negative | Negative |
| Matrix 3 | Negative | Negative | Negative |
| Matrix 4 | Negative | Negative | Negative |
| Matrix 5 | Negative | Negative | Negative |
| Matrix 6 | Negative | Negative | Negative |
| Matrix 7 | Negative | Negative | Negative |
Multi-Matrix Validation
Negative whole blood (EDTA-K2) was collected from 6 volunteers. Samples are analyzed unspiked, spiked at QC-0.5x and QC-2X level and screened using LDTD-MS/MS method. The method sensitivity, specificity, positive predictive value (PPV), negative predictive value (NPV) and accuracy are verified as followed:
|
Spiked Sample |
|||
|---|---|---|---|
| Yes | No | ||
| LDTD-MS/MS | Yes | TP (True positive) | FP (False positive) |
| No | FN (False negative) | TN (True negative) | |
Where:
Sensitivity: (TP / (TP + FN))
Specificity: (TN / (TN + FP))
PPV: (TP / (TP + FP))
NPV: (TN / (TN + FN))
Accuracy: ((TP+TN) / (TP + FN+TN+FP))
Table 7 shows the analysis results of 18 spiked samples for Temazepam.
| |
LC-MS/MS | ||
|---|---|---|---|
| Yes | No | ||
| LDTD-MS/MS | Yes | TP=6 | FP=0 |
| No | FN=0 | TN=12 | |
Validation results are reported in Table 8 for temazepam. Similar results are obtained for the other drugs.
| Parameters | Temazepam |
|---|---|
| Sensitivity | 1 |
| Specificity | 1 |
| PPV | 1 |
| NPV | 1 |
| Accuracy | 1 |
Conclusion
Luxon Ion Source® combined to a Sciex Q-Trap 5500 mass spectrometer system allows ultra-fast (8 seconds per sample) drug screening in whole blood using a simple and efficient sample preparation method.