Introduction
Cortisol analysis is used as biomarker of hypothalamic-pituitary-adrenal (HPA) activity associated to physiological stress. Cortisol is slowly and continuously incorporated into growing hair. This approach provides a long-term index of stress assessment. Gonzalez et al suggest a hair cortisol concentration median of 55 pg/mg hair (range 40-128 pg/mg hair) in healthy individuals with low levels of stress and 250 pg/mg hair (range 182-520 pg/mg hair) in stressed individuals.
Our goal for this application note is to develop a diagnostic tool to rapidly quantify cortisol in hair as a biomarker for long-term stress assessment.
LDTD®-MS/MS offers specificity combined with an ultra-fast analysis for an unrivaled quantification method. To develop this application, we focused on performing an efficient sample preparation, which will increase the speed of the analysis process.
Sample Preparation Method
Sample Collection
Thirty milligrams of hair samples (approximately 1 cm length) were transferred into the Precellys MK28R 2mL lysing kit (2 mL reinforced empty vials with 2.8 mm stainless steel beads from Bertin Technologies, Montigny-le-Bretonneux, France, ref : P000917-LYSK0-A.0).
Decontamination and Pulverization
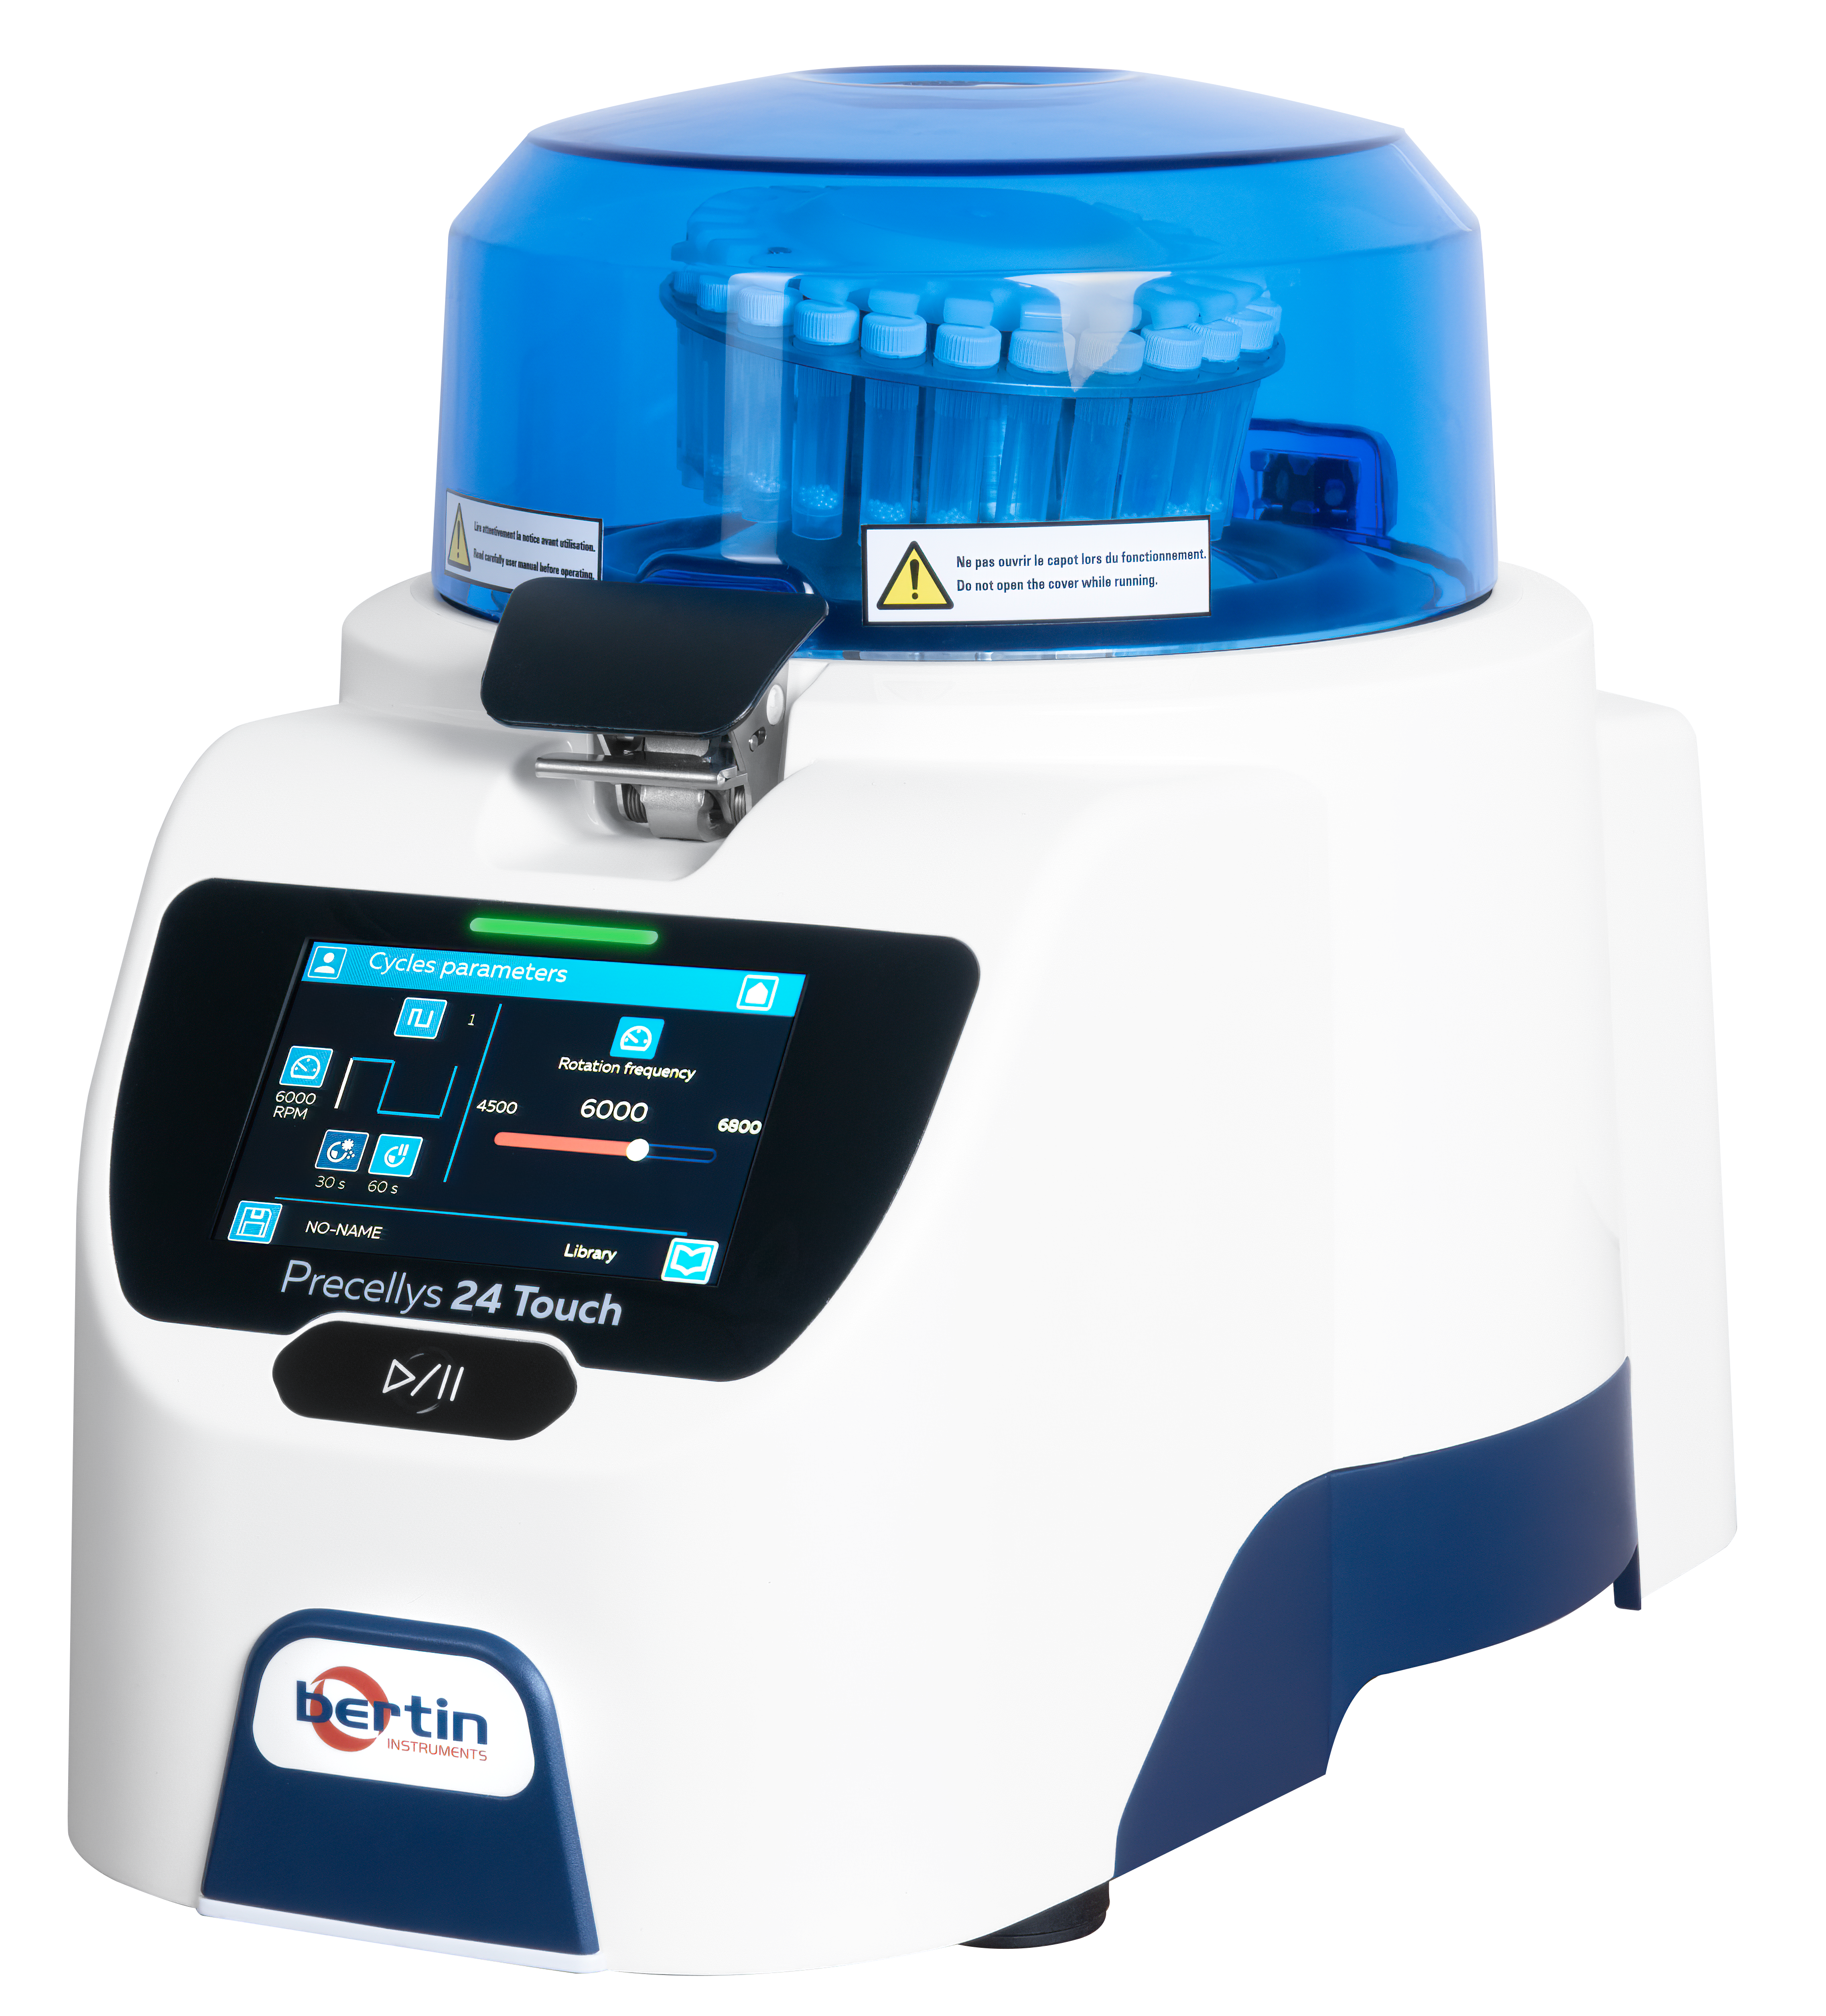
To remove undesired Cortisol from the hair surface, 1 mL of isopropanol (IPA) was added to the samples, and they were soaked for 3 minutes at room temperature. The washing solution was then discarded. This washing step was repeated twice. Afterwards, samples were dried with air flow (5 psi) for 60 minutes. Next, the cleaned hairs were pulverized into a fine powder (3 X 60 sec at 6500 rpm, 15 seconds pause time) using a Precellys 24 Touch system (Figure 1).
Sample Extraction
Samples were extracted as follows:
- 1500 μL of methanol into vial.
- Cap vial, vortex and place in sonicator bath for 1 hour.
- After incubation step, centrifuge vial at 5000 rpm for 5 minutes.
- Transfer 200 μL of extracted sample into borosilicate tubes (10X75mm)
- Add 40 μL of internal standard.
- Add 40 μL of methanol or working solution.
- Evaporate to dryness.
- Add 120 μL of Methanol:Water (1:1) into dry sample tube.
- Vortex
- Spot 6 μL of mixture on a LazWell™96-CORT plate
- Dry 8 minutes at 40°C
LDTD®-MS/MS Parameters
LDTD
Model: Luxon S-960, Phytronix
Carrier gas: 9.0 L/min (air)
Laser pattern:
- 6-second ramp to 65% power
MS/MS
MS model: Q-Trap System 5500, Sciex
Scan Time: 5 msec
Ionization: APCI
Analysis Method: Negative MRM mode
| Drugs | Transition | CE |
|---|---|---|
| Cortisol | 394.1 → 331.0 | -25 |
| Cortisol-d6 | 400.1 → 355.0 | -25 |
Results and Discussion
O2 Adduct Formation
Luxon Ion Source allows the formation of O2 adduct in negative ionization mode for chemical structure having conjugated keto in the structure (Figure 2).
 Figure 2 – O2 adduct of Cortisol
Method of Standard Addition (MSA)
The method of standard addition (MSA) involves adding different known amounts of a target analyte to fixed amounts of a sample to compensate for a sample matrix effect that enhances or depresses the analyte signal and used to evaluate the endogenic concentration of the compound in this matrix.
Zero and three additional fortifications of Cortisol were used to generate MSA curve. Cortisol addition concentration were plotted against the peak area ratio Cortisol/Internal standard (ISTD). A linear regression curve was performed, and the X-intercept was evaluated to get the endogenic concentration value of Cortisol in this matrix (Figure 3).
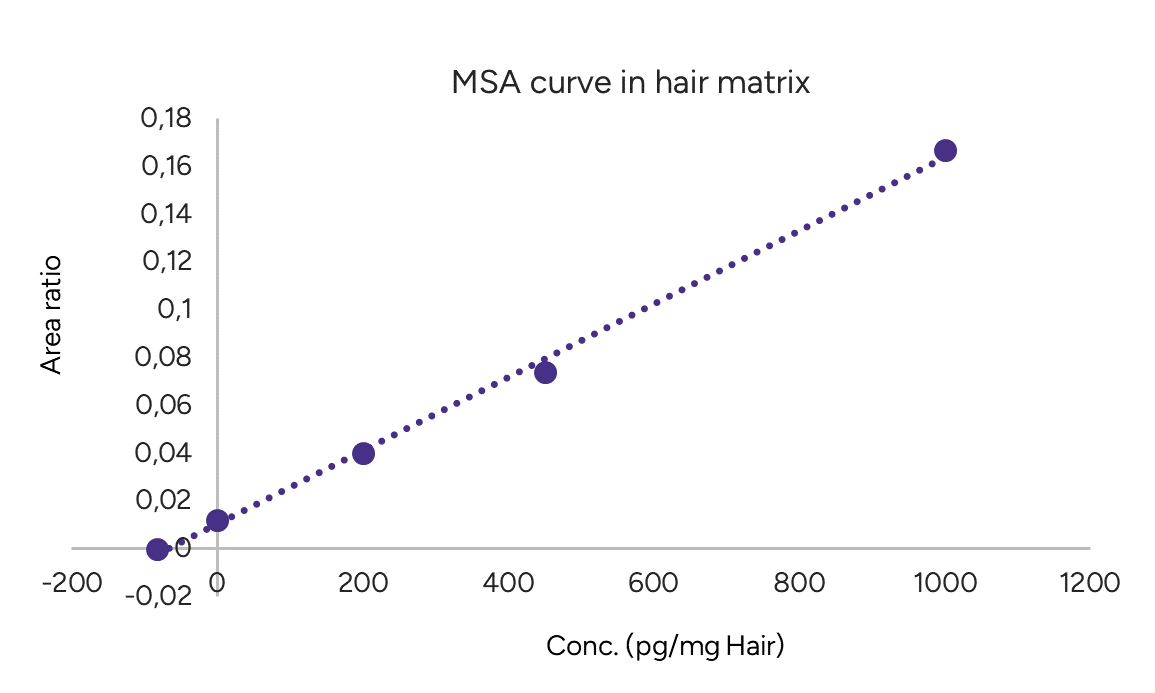 Figure 3 – MSA curve of Cortisol in hair matrix
Method Precision Evaluation
A pool of digested matrix was fortified with a Cortisol addition and the endogenic concentration was evaluated using a MSA curve. Table 2 shows the linearity results (Y= mX + b) and the calculated concentration. A precision of 13.1% was obtained.
| m | b | Conc. (pg/mg) |
|
|---|---|---|---|
| Curve 1 | 0.00015587 | 0.01059 | 67.9 |
| Curve 2 | 0.00016095 | 0.01301 | 80.8 |
| Curve 3 | 0.00015999 | 0.00986 | 61.6 |
| Curve 4 | 0.00014554 | 0.0131 | 90.0 |
| Curve 5 | 0.00015596 | 0.01184 | 75.9 |
| Curve 6 | 0.00016204 | 0.01081 | 66.7 |
| Curve 7 | 0.00014794 | 0.01234 | 83.4 |
| Curve 8 | 0.00016047 | 0.01351 | 84.2 |
| Mean | 76.3 | ||
| %CV | 13.1 |
Wet Stability of Sample Extracts
Following the extraction, sample extracts are kept at 4°C in closed containers. After 4 days, sample extracts are spotted on a LazWell™ plate, dried and analyzed. MSA curve was generated. Precision of endogenic concentration and % difference against (T=0) values are reported in Table 3. All the results are within the acceptable criteria range (%CV ≤ 20% and %Difference ±20%) for 4 days at 4°C.
Dry Stability of Samples Spotted in LazWell™
Extracted samples are spotted onto a LazWell plate, dried and kept at room temperature for 3 hours before analysis. MSA curve was generated. Precision of endogenic concentration and % difference against (T=0) values are reported in Table 3. All the results are within the acceptable criteria range (%CV ≤ 20% and %Difference ±20%) for 3 hours at room temperature.
| Parameters | Dry stability | Wet stability | ||
|---|---|---|---|---|
| Stability Time | T0 | 3h/RT | T0 | 4 days /4°C |
| Conc. (pg/mg) | 76.3 | 87.1 | 76.3 | 86.1 |
| %CV | 13.1 | 2.2 | ||
| %Diff | 13.2 | 12.1 | ||
Multi-Matrix Evaluation
Hair samples were collected from 10 volunteers. Samples were analyzed using MSA approach. Table 4 shows calculated concentration of samples. Based on Gonzalez range:
- Range 40-128 pg/mg hair: Low levels of stress
- Range 182-520 pg/mg hair: High levels of stress
- A concentration within those ranges were reported as: Medium levels of stress.
Three samples were detected with Cortisol concentrations associated to a low level of stress. Seven samples show high levels of stress.
| Sample ID | Cortisol (pg/mg) |
Level of stress |
|---|---|---|
| Sample 1 | 314.0 | High |
| Sample 2 | 214.8 | High |
| Sample 3 | 92.1 | Low |
| Sample 4 | 335.3 | High |
| Sample 5 | 60.0 | Low |
| Sample 6 | 278.2 | HIgh |
| Sample 7 | 249.8 | High |
| Sample 8 | 371.8 | High |
| Sample 9 | 195.2 | High |
| Sample 10 | 107.0 | Low |
Conclusion
The Precellys®24 Touch can be successfully used to pulverize hair samples for mass spectrometry analysis of Cortisol. The Precellys 24 Touch combined with the Luxon Ion Source and Sciex Q-Trap 5500 mass spectrometer system allows ultra-fast (8 seconds per sample) screening of Cortisol in hair using a simple sample preparation method.