Introduction
The rapid quantification of cystine in urine can be useful for the detection of cystinuria, an autosomal recessive disorder (MariaLuisa Cabello-Tomás, 1999). Newborn screening for this disease can be performed by thin layer chromatography (Auray-Blais et al., 2021). Cystinuria is characterized by the formation of cystine kidney stones. Overexcretion of poorly soluble cystines causes accumulation of stones in the kidneys due to precipitation (Chillarón et al. 2010). Previously, the screening test for cystine in urine was qualitative . However, rapid quantification of cystine in urine can be helpful in confirming the diagnosis. Additionally, a high concentration of cystine in the urine can lead to kidney stones (obstruction) or kidney failure (Wear et al., 2005).
Our goal for this application note is to develop a diagnostic tool to rapidly quantify cystine in urine, which will allow the rapid diagnosis of certain autosomal disorders, such as cystinuria.
LDTD-MS/MS offers specificity combined with an ultra-fast analysis for an unrivaled quantification method. To develop this application, we focused on performing an efficient sample preparation, which will increase the speed of the analysis process and confirm diagnoses more quickly.
Sample Preparation Method
Stock solutions of Cystine (2000 µg/mL) and Cystine-d6 (100 µg/mL) were prepared in sodium hydroxide solution (50 mM). Then, artificial urine samples were spiked to generate a calibration curve and QCs.
Derivatization and Extraction procedure
- 5 µL of urine sample were transferred to a borosilicate tube.
- 5 µL of Internal standard (Cystine-d6: 20 µg/mL in water) were added to each sample.
- 100 µL of Butanol-HCl (3N) were added.
- Mix
- Transfer in block heater and let react at 65 °C for 40 minutes
- 100 µL of mixture of NaOH (1M): K2HPO4(500 mM) / 0.3:1 was added.
- 100 µL of MTBE were added in the tube.
- Mix
- Phase separation by gravity
- 50 µL of upper layer phase were transferred in a new tube and mixed with 50 µL of BSA solution (200 µg/mL in MeOH:Water / 75:25).
- Spot 5 µL of mixture on a LazWell™ 96 plate
- Dry 4 minutes at 40 °C
LDTD®-MS/MS Parameters
LDTD
Model: Luxon S-960, Phytronix
Carrier gas: 6.0 L/min (air)
Laser pattern:
3-second ramp to 55% power
MS/MS
MS model: QTrap® System 5500, Sciex
Curtain: 20
CAD: 8
IonSpray Voltage: 5500
Temperature, GS1 and GS2 set to zero.
Scan Time: 100 msec
Total run time: 0.15 minutes per sample
Analysis Method: Positive MRM mode
Table 1 – MRM transitions for LDTD-MS/MS
| Transition | CE (V) | |
|---|---|---|
| Cystine | 353.0 → 130.0 353.0 → 208.0 |
20 |
| Cystine-d6 | 359.0 → 131.0 359.0 → 211.0 |
20 |
Results and Discussion
Validation Test
Calibration curves ranging from 1 to 100 mg/mL were prepared in synthetic urine. Two sets of QCs were prepared. One set in synthetic urine (QC-L, QC-M and QC-H) and a second set in standard urine (UQC-L and UQC-M). Replicate extractions were deposited onto a LazWell™ plate and dried before analysis. The peak area against the internal standard (IS) ratio was used to normalize the signal.
Linearity
The calibration curves were plotted using the peak area ratio and the nominal concentration of standards. For the linearity test, the following acceptance criteria was used:
- Linear regression (r) must be ≥ 995
Table 2 shows the inter-day correlation coefficients for Cystine. Values greater than 0.995 are obtained. Figure 3 shows a typical calibration curve result for Cystine.
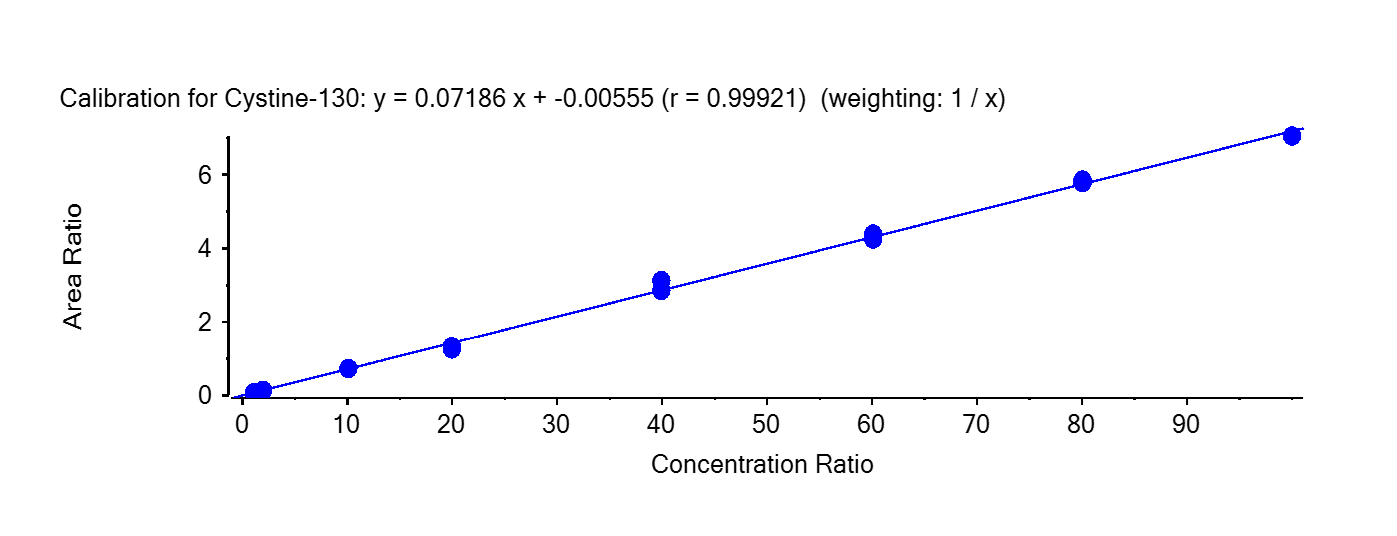
Table 2 – Inter-day calibration curve correlation coefficients
| Cystine | R | |
|---|---|---|
| Curve 1 | Y = 0.07186 x – 0.00555 | 0.99921 |
| Curve 2 | Y = 0.07124 x – 0.01314 | 0.99812 |
| Curve 3 | Y = 0.06890 x – 0.04453 | 0.99882 |
| Curve 4 | Y = 0.06882 x – 0.04509 | 0.99919 |
Precision and Accuracy
For the accuracy and precision evaluation, the following acceptance criteria were used:
- Each concentration must not exceed 15% CV
- Each concentration must be within 100 ± 15% of the nominal concentration
For the intra and inter-run precision and accuracy experiment, each QC was analyzed in sextuplicate, on four different runs. Table 3 and 4 show the intra and inter-run precision and accuracy results for Cystine. The obtained %CV was below 15% and the accuracy was within 15% of the nominal value.
Table 3 – Intra-Run Precision and Accuracy of Cystine
| Cystine | QC-L1 | QC-M1 | QC-H1 | UQC-L2 | UQC-M2 |
|---|---|---|---|---|---|
| Conc (mg/mL) | 3 | 50 | 70 | 11.6 | 61.6 |
| N (μg/mL) | 6 | 6 | 6 | 6 | 6 |
| Mean (μg/mL) | 2.9 | 50.4 | 73.8 | 11.4 | 61.1 |
| %CV | 5.4 | 3.2 | 4.4 | 6.6 | 6.3 |
| %Nom | 98.3 | 100.8 | 105.5 | 98.1 | 99.2 |
Table 4 – Inter-Run Precision and Accuracy of Cystine
| Cystine | QC-L1 | QC-M1 | QC-H1 | UQC-L2 | UQC-M2 |
|---|---|---|---|---|---|
| Conc (mg/mL) | 3 | 50 | 70 | 11.6 | 61.6 |
| N (μg/mL) | 24 | 24 | 24 | 24 | 24 |
| Mean (μg/mL) | 3.0 | 50.0 | 69.3 | 11.6 | 61.9 |
| %CV | 7.1 | 4.0 | 8.8 | 7.8 | 6.7 |
| %Nom | 99.3 | 100.0 | 98.9 | 100.4 | 100.4 |
Note 2: Cystine spiked in urine sample
Wet Stability of Sample Extracts
Following the extraction, sample extracts are kept at 4°C in closed containers protected from light. After a week, sample extracts are spotted on a LazWell™ plate, dried and analyzed. The precision and accuracy results of QCs in synthetic urine samples are reported in Table 5. Results of QCs in urine samples are reported in Table 6. All the results are within the acceptable criteria range for one week at 4°C.
Dry Stability of Samples Spotted in LazWell™
Extracted samples are spotted onto a LazWell™ plate, dried and kept at room temperature for 4 hours before analysis. The precision and accuracy results of QCs in synthetic urine samples are reported in Table 5. Results of QCs in urine samples are reported in Table 6. All the results are within the acceptable criteria range for 4 hours at room temperature.
Table 5 – Wet and Dry Stability of Cystine in Synthetic Urine Sample
| Parameters | Dry stability (4 hours / RT) |
Wet stability (1 week / 4°C) |
||||
|---|---|---|---|---|---|---|
| QC | QC-L | QC-M | QC-H | QC-L | QC-M | QC-H |
| Conc. (mg/mL) | 3 | 50 | 70 | 3 | 50 | 70 |
| N | 6 | 6 | 6 | 6 | 6 | 6 |
| Mean (mg/mL) | 3.1 | 52.1 | 73.9 | 3 | 52.6 | 72.6 |
| %CV | 6.2 | 7.0 | 8.6 | 3.3 | 3.3 | 8.4 |
| %Nom | 103.8 | 104.1 | 105.6 | 100.37 | 105.2 | 103.7 |
Table 6 -Wet and Dry Stability of Cystine in Urine Sample
| Parameters | Dry stability (4 hours / RT) |
Wet stability (1 week / 4°C) |
||
|---|---|---|---|---|
| QC | UQC-L | UQC-M | UQC-L | UQC-M |
| Conc. (mg/mL) | 11.6 | 61.6 | 11.6 | 61.6 |
| N | 6 | 6 | 6 | 6 |
| Mean (mg/mL) | 11.4 | 58.7 | 11.4 | 62.5 |
| %CV | 4.7 | 7.1 | 2.6 | 5.2 |
| %Nom | 95.5 | 95.3 | 98.4 | 101.5 |
Cross validation study
Urine samples from real patients were tested with this method to correlate with results obtained by traditional LC-MS/MS. The percentage difference between the values is evaluated. A difference of less than 15% is obtained. The results are reported in Table 7.
Table 7 – Cross validation between LC-MS/MS and LDTD-MS/MS
| Cystine | U1 | U2 | U3 | U4 | U5 | U6 | U7 | U8 | U9 | U10 | U11 | U12 |
|---|---|---|---|---|---|---|---|---|---|---|---|---|
| LC (mg/mL) | 11.3 | 20.9 | 17.2 | 25.9 | 16.2 | 27.1 | 19.1 | 29.3 | 3.0 | 12.3 | 11.2 | 19.6 |
| LDTD (mg/mL) | 13.1 | 23.4 | 18.4 | 28.1 | 17.0 | 28 | 19.4 | 32 | 2.5 | 12.1 | 11.3 | 20.9 |
| %Diff (%) | 7.5 | 5.6 | 3.5 | 4.1 | 2.4 | 1.6 | 0.8 | 4.4 | -8.6 | -0.8 | 0.3 | 3.2 |
Conclusion
The Luxon Ion Source® combined with the Sciex QTrap® 5500 mass spectrometer system enables the rapid analysis of cystine in urine. This method of analysis can thus be applied at the clinical level in order to diagnose certain autosomal recessive disorders such as cystinuria.