Introduction
Analysis of 25-Hydroxy Vitamin D2 and D3 metabolites (Abbreviated: 25(OH)D2 and 25(OH)D3) in serum samples are used to determine a person’s vitamin D status. Vitamin D deficiency is associated to different diseases.
To increase throughput analysis capacity of a laboratory, a fast and specific method using Laser Diode Thermal Desorption (LDTD) ion source combined to a mass spectrometer equipped with the SelexION™ technology is demonstrated.
LDTD-MS/MS offers specificity combined with an ultra-fast analysis for an unrivaled quantitation method. In this application, we focused on performing a quick and simple preparation method. To reach proper selectivity, a combination of superoxide adducts, and ions mobility spectrometer are used.
Luxon Ionization Source
The Luxon Ion Source® (Figure 1) is the second-generation sample introduction and ionization source based on the LDTD® technology for mass spectrometry. Luxon Ion Source® uses Fiber-Coupled Laser Diode (Figure 2) to obtain unmatchable thermal uniformity giving more precision, accuracy and speed. The process begins with dry samples which are rapidly evaporated using indirect heat. The thermally desorbed neutral molecules are carried into a corona discharge region. High efficiency protonation and strong resistance to ionic suppression characterize this type of ionization and is the result of the absence of solvent and mobile phase. This thermal desorption process yields high intensity molecular ion signal in less than 1 second sample to sample and allows working with very small volumes.
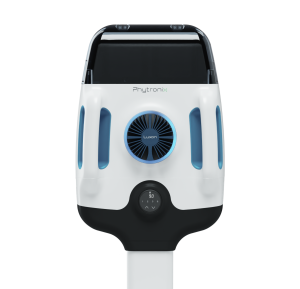
Figure 1 – Luxon Ion Source®
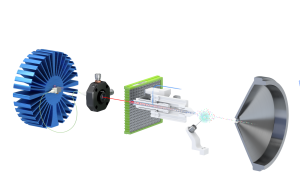
Figure 2 – Schematic of the Luxon Ionization Source
Sample Preparation Method
- 50 µL serum sample.
- 45 µL internal standard (25 (OH)D2-d3 and 25 (OH)D3-d6 at 167 ng/mL in MeOH).
- Vortex.
- Add 300 µL Hexane.
- Vortex.
- Phase separation by gravity
- Spot 6 µL upper-layer phase on a LazWell™96 plate
- Dry 1 minute at room temperature / air flow
Luxon®-MS/MS Parameters
Luxon
Model: Luxon S-960, Phytronix
Carrier gas: 4.5 L/min (air)
Laser pattern:
- 6-second ramp to 55% power
- Hold 3 seconds at 55% power
MS/MS
MS model: Q-Trap System® 5500, Sciex with SelexION™ technology
Scan Time: 40 msec
Total run time: 12 seconds per sample
Ionization: Negative APCI
Analysis Method: MRM mode
SelexION:
DT: Low
MD: None
SV: 4200
DMO: 50
DR: Off
Note: A specific adduct of O2 (Figure 3) generated during negative APCI ionisation is used as primary ion mass.
Formula: M + O2–
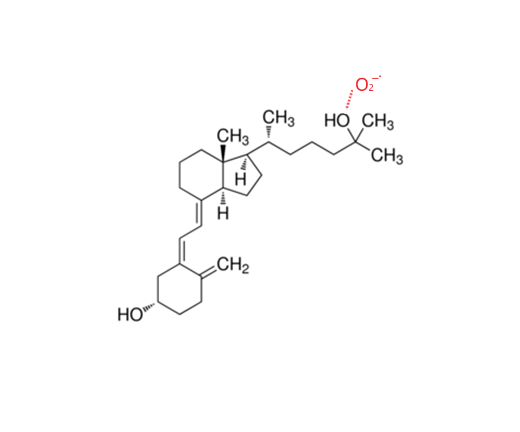
Figure 3 – Superoxyde ion of 25(OH)D3
| Transition | CE | COV | |
|---|---|---|---|
| 25(OH)D 3 | 432.2 🡪 32.0 | -35 | 10.2 |
| 25(OH)D 2 -d 6 | 438.3 🡪 32.0 | -35 | 10.2 |
| 25(OH)D 2 | 444.2 🡪 32.0 | -35 | 11.1 |
| 25(OH)D 2 -d 3 | 447.3 🡪 32.0 | -35 | 11.1 |
Results and Discussion
Linearity
Standard from CHROMSYSTEMS® (Multilever serum calibrator set) are extracted and used to generate calibration curve (5.29 to 144 ng/mL and 5.07 to 135 ng/mL for 25(OH)D2 and 25(OH)D3, respectively). Table 3 shows the inter-day correlation coefficients for 25(OH)D2 and 25(OH)D3. Values greater than 0.99 are obtained for both drugs. Figure 4 and 5 show typical calibration curve results for 25(OH)D2 and 25(OH)D3.
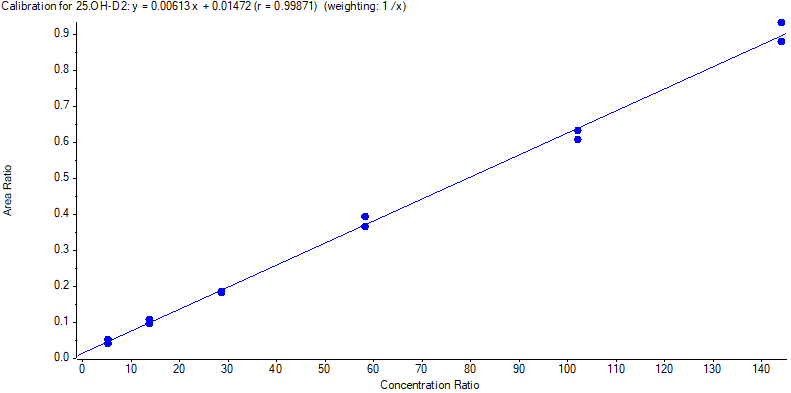
Figure 4 – Standard Curve for 25(OH)D2
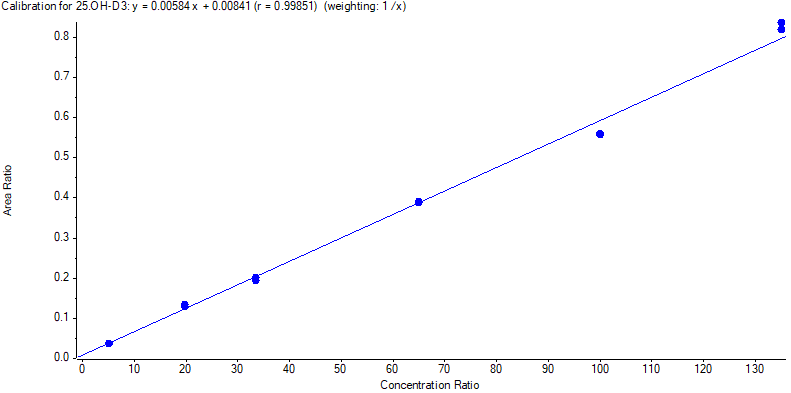
Figure 5 – Standard Curve for 25(OH)D3
| 25(OH)D 2 | 25(OH)D 3 | |
|---|---|---|
| Curve 1 | 0.99887 | 0.99805 |
| Curve 2 | 0.99790 | 0.99900 |
| Curve 3 | 0.99873 | 0.99863 |
| Curve 4 | 0.99574 | 0.99915 |
| Curve 5 | 0.99749 | 0.99949 |
| Curve 6 | 0.99752 | 0.99924 |
Accuracy and Precision
Real serum samples having low concentration of 25(OH)D2 and 25(OH)D3 are spiked to get three QC level (low, medium and high). QC samples are extracted and quantified again the calibration curve. For the inter-run precision and accuracy experiment, each fortified sample sets are analyzed in triplicate on six different days. Table 3 and 4 show the inter-run result. Each concentration is not exceeding 15% CV and the mean concentration are within ±15% of expected value.
| QC-Low | QC-Med | QC-High | |
|---|---|---|---|
| Expected conc.(ng/mL) | 16,1 | 22,9 | 101,5 |
| Calc. conc (ng/mL) | 15,7 | 23,2 | 105,5 |
| N | 18 | 18 | 18 |
| %CV | 10,3 | 7,5 | 2,9 |
| %Nom | 97,7 | 101,6 | 104,0 |
| QC-Low | QC-Med | QC-High | |
|---|---|---|---|
| Expected conc.(ng/mL) | 14,2 | 33,2 | 107,2 |
| Calc. conc (ng/mL) | 14,4 | 36,6 | 112,1 |
| N | 18 | 18 | 18 |
| %CV | 10,6 | 5,9 | 4,2 |
| %Nom | 101,6 | 110,5 | 104,6 |
Cross Validation
Real patient’s serum samples (N=145) have been tested with this method to correlate with results obtained by traditional LC-MS/MS. The Passing-Bablok regression (Figure 6) reveals a good correlation and no significant deviation from linearity. Bland and Altman plot (Figure 7) show the mean bias (%) of the two methods. All samples are within the confidence interval of 95%.
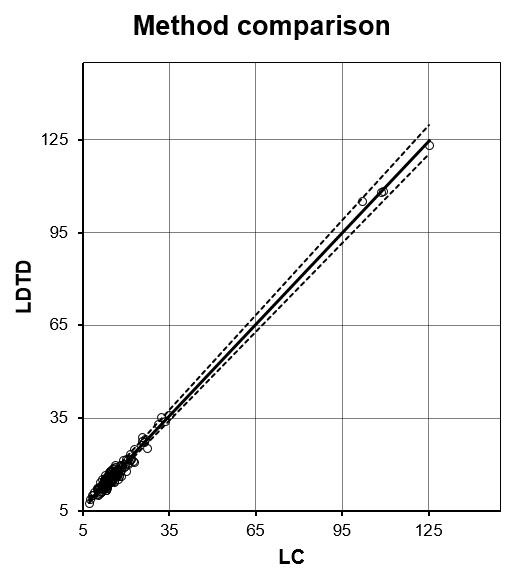
Figure 6 – Passing-Bablok regression curve
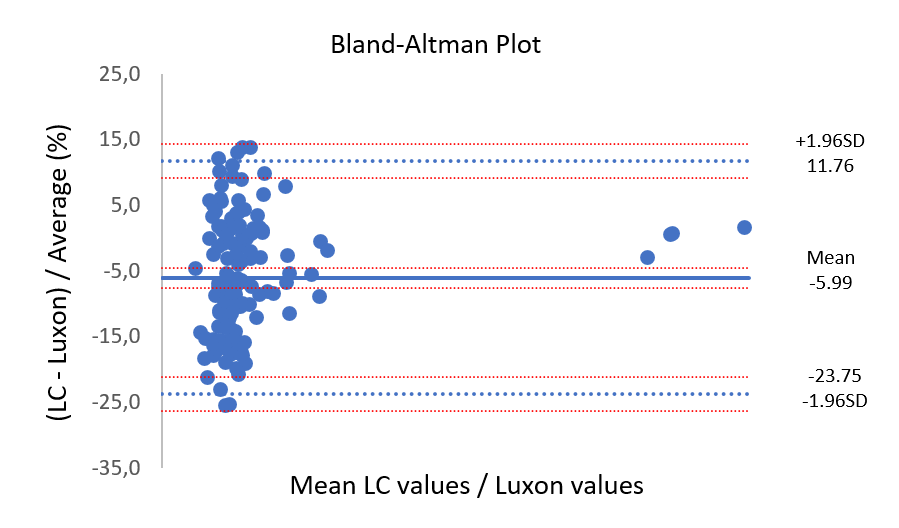
Figure 7 – Bland and Altman plot
Conclusion
Luxon Ion Source® combined to Sciex Q-Trap 5500 mass spectrometer system with SelexION technology allows ultra-fast (12 seconds per sample) quantification of 25(OH)D2 and 25(OH)D3 metabolite in serum samples using a simple generic sample preparation method.