Introduction
Hydrocarbons C20 to C80 are usually analyzed by GC-MS systems using the Electron Ionization (EI) mode since LC-MS does not properly ionize this type of molecule. To increase the sample throughput, the Laser Diode Thermal Desorption (LDTD) technology shows promising results for the ionization and analysis of this molecular group. Luxon combined with a High-Resolution Mass Spectrometer (HRMS) is used to analyze hydrocarbon chains from commercial oil. The Luxon-HRMS is a rapid analysis approach in which molecules are thermally desorbed and then are channeled, using a carrier gas, to a corona discharge region for ionization prior to detection via a mass spectrometer. C20, C26, C40 and C50 straight-chain alkanes are used to validate the ionization process.
We propose to perform a quick hydrocarbon profile evaluation using Laser Diode Thermal Desorption High Resolution Mass Spectrometry (LDTD-HRMS).
Luxon Ionization Source
The Luxon Ion Source® (Figure 1) is the second-generation sample introduction and ionization source based on the LDTD® technology for mass spectrometry. Luxon Ion Source® uses Fiber-Coupled Laser Diode (Figure 2) to obtain unmatchable thermal uniformity providing more precision, accuracy and speed. The process begins with dry samples which are rapidly evaporated using indirect heat. The thermally desorbed neutral molecules are carried into a corona discharge region. High efficiency protonation and strong resistance to ionic suppression characterize this type of ionization and is the result of the absence of solvent and mobile phase. This thermal desorption process yields high-intensity molecular ion signal in less than 1 second sample-to-sample and allows working with very small volumes.
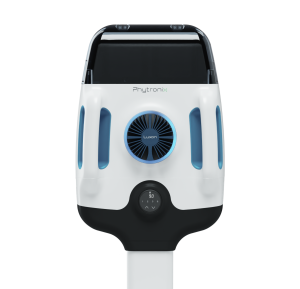
Figure 1 – Luxon Ion Source®
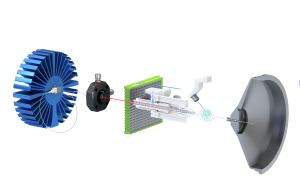
Figure 2 – Schematic of the Luxon Ionization Source
Sample Preparation Method
Standard
2 µL of Eicosane (1.3 mg/mL), Hexacosane (1.4 mg/mL), Tetracontane (0.65 mg/mL) and Pentacontane (0.15 mg/mL) in toluene are spotted into 96-LazWell™ plates and evaporated to complete dryness. Luxon-HRMS analysis is done after a complete evaporation.
Sample
2 µL of commercial oil is diluted in toluene at 1 ppm, spotted into 96-LazWell™ plates and evaporated to complete dryness. Luxon-HRMS analysis is done after a complete evaporation.
LDTD-HRMS Parameters
LDTD
Model: Phytronix, T-960
Carrier gas: 3 L/min (air)
Laser pattern: 3 second ramp to 45% power
MS/MS
Model: Q-Exactive™, Thermo Scientific
Ionization: APCI (Positive)
Scan mode: 200 to 1200 m/z
Results and Discussion
Hydrocarbon Ionization process
During the desorption process, a dehydrogenation occurs on the LazWell™ plate surface to generate a double bond. The alkene formed is transferred via the carrier gas and ionized by the corona discharge. Figure 3 shows the dehydrogenation process.
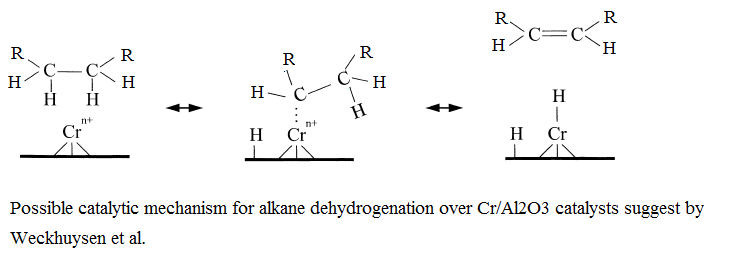
Figure 3 – Dehydrogenation process standard analysis
Five successive wells are desorbed in the same MS file (Blank, C20, C26, C40 and C50). The mass spectrum and exact mass extraction are acquired. Results are reported in Table 1 and in Figure 4.
| Standard | Theoretical Mass | Experimental results |
|---|---|---|
| C20 | 281.320825 | 281.32049 |
| C26 | 365.414725 | 365.41466 |
| C40 | 561.633825 | 561.63382 |
| C50 | 701.790325 | 701.79015 |
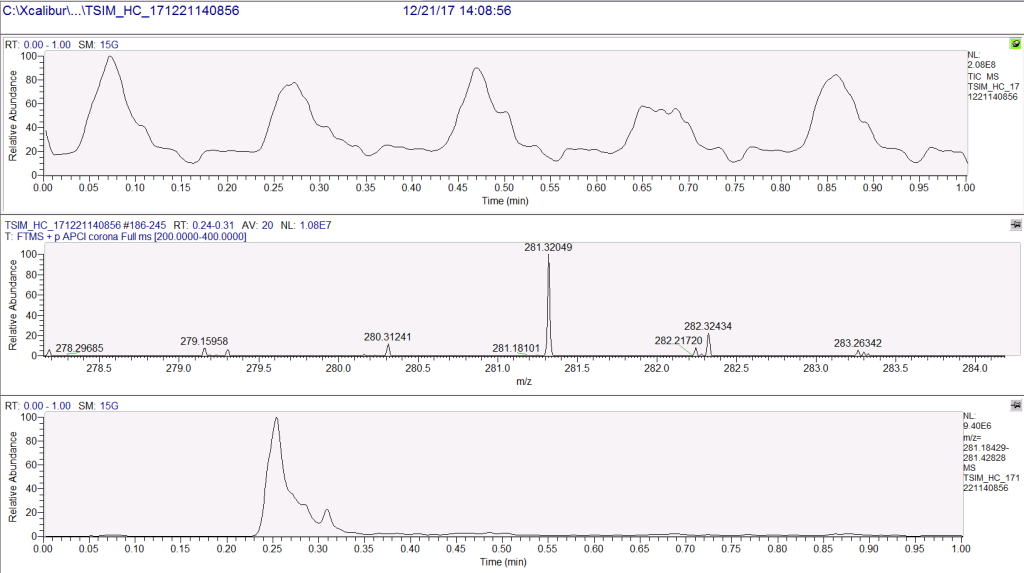
Figure 4 – C20 standard desorption
Oil sample profile analysis
Commercial oil is diluted with toluene at 1 ppm and analyzed by Luxon-HRMS. The Figure 5 shows the exact mass profile. The analysis of the High-Resolution mass spectrum highlighted two different profile distributions.
To evaluate the profile structures, the exact mass is extracted, and peak areas are reported. The major profile (Profile 1) is composed of the highest hydrocarbon peaks of the same unsaturation number (6) from all the sub-profile distributions. Profile 2 shows the unsaturation distribution of molecules having 27 carbon atoms. A similar unsaturation distribution is observed for all alkenes (C20, C21, C22, …).
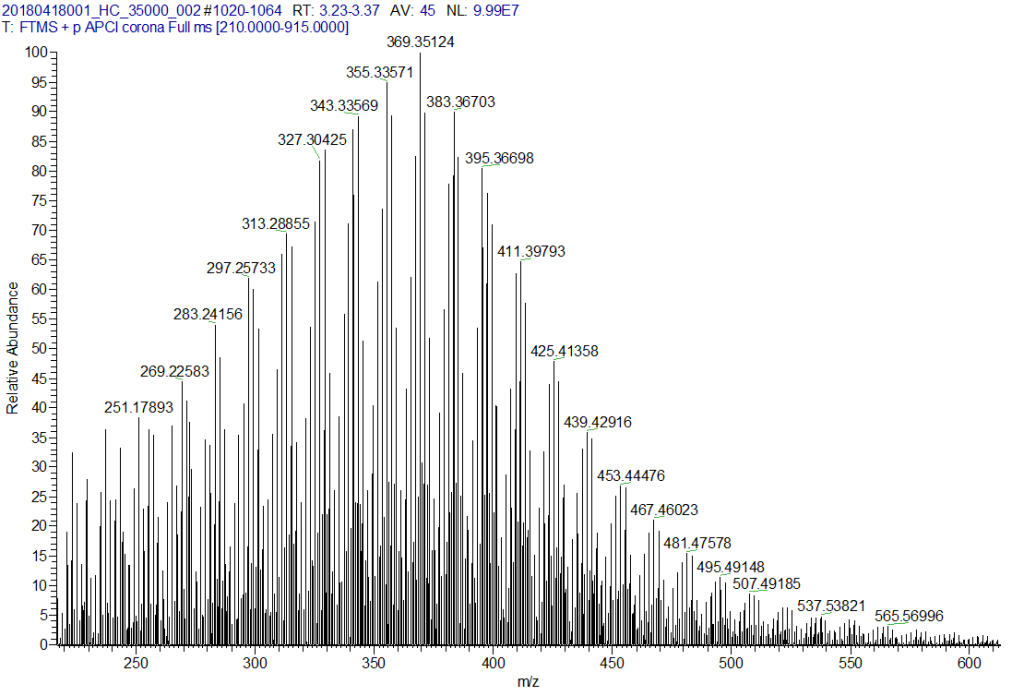
Figure 5 – Commercial oil exact mass profile
Profile 1 – Hydrocarbon distribution of 6 degrees of unsaturation
Using the accurate mass spectra acquired and an elemental composition tool, molecules having an unsaturation degree of 6 are reported. Figure 6 shows the peak area profile of this group. Table 2 shows the empirical formula and exact mass.
| Formula | Exact Mass | Peak area | ||
|---|---|---|---|---|
| C | H | M – 2 + H | X 10 6 | |
| C17 | 17 | 25 | 229.195625 | 178 |
| C18 | 18 | 27 | 243.211275 | 264 |
| C19 | 19 | 29 | 257.226925 | 291 |
| C20 | 20 | 31 | 271.242575 | 328 |
| C21 | 21 | 33 | 285.258225 | 399 |
| C22 | 22 | 35 | 299.273875 | 509 |
| C23 | 23 | 37 | 313.289525 | 598 |
| C24 | 24 | 39 | 327.305175 | 727 |
| C25 | 25 | 41 | 341.320825 | 779 |
| C26 | 26 | 43 | 355.336475 | 836 |
| C27 | 27 | 45 | 369.352125 | 911 |
| C28 | 28 | 47 | 383.367775 | 789 |
| C29 | 29 | 49 | 397.383425 | 691 |
| C30 | 30 | 51 | 411.399075 | 569 |
| C31 | 31 | 53 | 425.414725 | 416 |
| C32 | 32 | 55 | 439.430375 | 312 |
| C33 | 33 | 57 | 453.446025 | 244 |
| C34 | 34 | 59 | 467.461675 | 183 |
| C35 | 35 | 61 | 481.477325 | 134 |
| C36 | 36 | 63 | 495.492975 | 101 |
| C37 | 37 | 65 | 509.508625 | 75 |
| C38 | 38 | 67 | 523.524275 | 59 |
| C39 | 39 | 69 | 537.539925 | 43 |
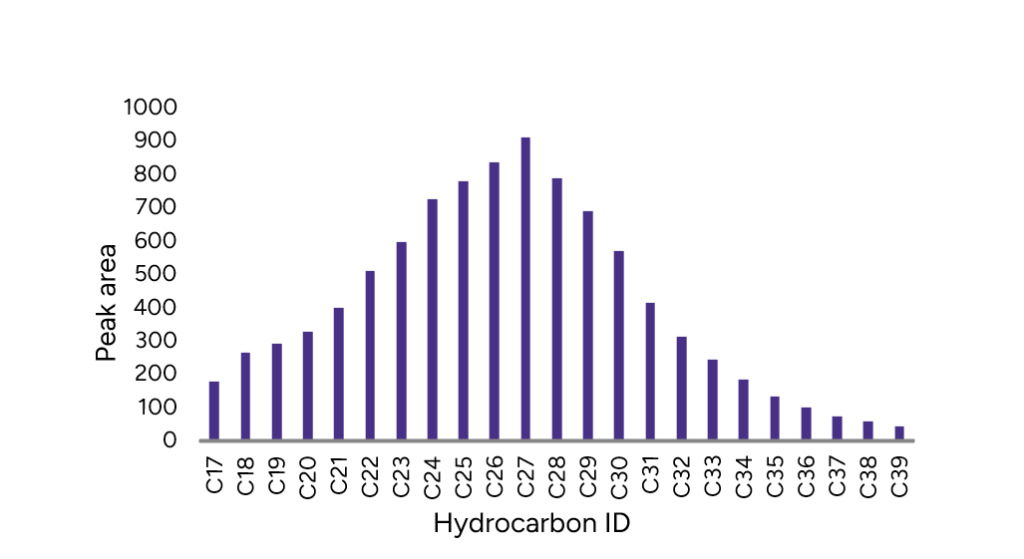
Figure 6 – Peak distribution of Profile 1
Profile 2 – Unsaturation profile
Using the accurate mass detected and the elemental composition tool, molecules having 27 carbons with different unsaturation degrees are reported. Figure 7 shows the peak area profile of this group. Table 3 shows the empirical formula and calculated exact mass.
| Formula | Exact Mass | Peak area | ||
|---|---|---|---|---|
| C | H | M – 2 + H | X 10 6 | |
| Unsat. 15 | 27 | 27 | 351.211275 | 17 |
| Unsat. 14 | 27 | 29 | 353.226925 | 39 |
| Unsat. 13 | 27 | 31 | 355.242575 | 40 |
| Unsat. 12 | 27 | 33 | 357.258225 | 73 |
| Unsat. 11 | 27 | 35 | 359.273875 | 154 |
| Unsat. 10 | 27 | 37 | 361.289525 | 229 |
| Unsat. 9 | 27 | 39 | 363.305175 | 369 |
| Unsat. 8 | 27 | 41 | 365.320825 | 541 |
| Unsat. 7 | 27 | 43 | 367.336475 | 727 |
| Unsat. 6 | 27 | 45 | 369.352125 | 911 |
| Unsat. 5 | 27 | 47 | 371.367775 | 784 |
| Unsat. 4 | 27 | 49 | 373.383425 | 455 |
| Unsat. 3 | 27 | 51 | 375.399075 | 16 |
| Unsat. 2 | 27 | 53 | 377.414725 | 5 |
| Unsat. 1 | 27 | 55 | 379.430375 | 2 |
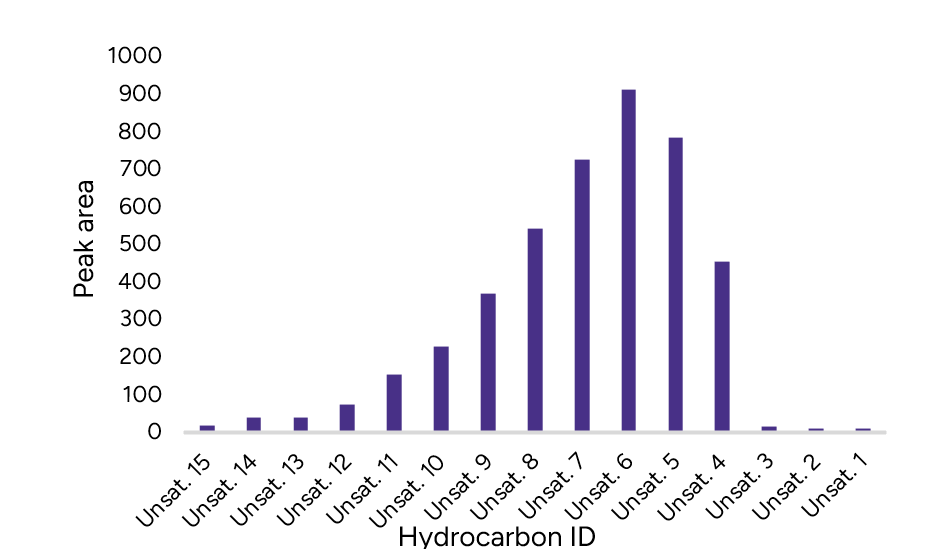
Figure 7 – Peak distribution of Profile 2
Conclusion
Luxon Ion Source combined with a Q-Exactive system allows ultra-fast (8 seconds per sample) analysis of hydrocarbon (C20 to C80) in different petroleum samples.