Introduction
Many countries worldwide are currently experiencing a public health crisis due to the abuse of illicitly manufactured fentanyl (IMF) and its analogues. Unfortunately, IMF and its analogues are not always part of routine toxicology testing. Thus, there is an urgent need for developing sensitive screening tools for urine samples.
Our goal for this application note is to use a Liquid-Liquid Extraction sample preparation method for the screening of all fentanyl analogues in a single operation in LDTD-MS/MS.
LDTD-MS/MS offers specificity combined with an ultra-fast analysis for an unrivaled screening method. To develop this application, we focused on performing a quick and simple preparation method. Fourteen (14) illicitly manufactured fentanyl (IMF) are analyzed simultaneously with quantitative screening results obtained in less than 9 seconds per sample. Specific cut-off values were attained for each individual drug.
Luxon Ionization Source
The Luxon Ion Source® (Figure 1) is the second-generation sample introduction and ionization source based on the LDTD® technology for mass spectrometry. Luxon Ion Source® uses Fiber-Coupled Laser Diode (Figure 2) to obtain unmatchable thermal uniformity giving more precision, accuracy and speed. The process begins with dry samples which are rapidly evaporated using indirect heat. The thermally desorbed neutral molecules are carried into a corona discharge region. High efficiency protonation and strong resistance to ionic suppression characterize this type of ionization and is the result of the absence of solvent and mobile phase. This thermal desorption process yields high intensity molecular ion signal in less than 1 second sample to sample and allows working with very small volumes.
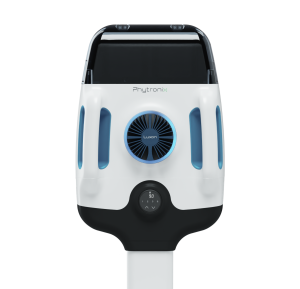
Figure 1 – Luxon Ion Source®
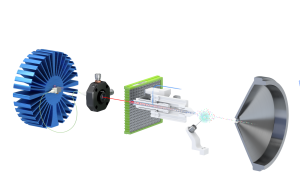
Figure 2 – Schematic of the Luxon Ionization Source
Sample Preparation Method
- Add 50 µL urine sample
- Add 5 µL internal standard (Fentanyl-d5 and Norfentanyl-d5, 100 ng/mL and 300 ng/mL in MeOH:Water/1:1).
- Vortex
- Add 50 µL NaOH (0.1N)
- Add 200 µL MTBE
- Vortex
- Spot 5 µL upper-layer phase on a LazWell™96 plate
- Dry 1 minute at room temperature
- LDTD-MS/MS analysis
LDTD®-MS/MS Parameters
LDTD
Model: Luxon S-960, Phytronix
Carrier gas: 3 L/min (air)
Laser pattern:
- 3-second ramp to 65% power
- Hold 2 seconds at 65% power
MS/MS
MS model: Q-Trap System® 5500, Sciex
Scan Time: 5 msec
Total run time: 8 seconds per sample
Ionization: APCI
Analysis Method: Positive MRM mode
| LDTD | CE | |
|---|---|---|
| Acetyl Norfentanyl | 219.1 🡪 84.1 | 15 |
| Norfentanyl | 233.2 🡪 84.2 | 25 |
| Norfentanyl-d5 | 238.2 🡪 84.0 | 25 |
| Butyryl norfentanyl | 247.2 🡪 84.2 | 25 |
| cis-3-Methyl norfentanyl | 247.2 🡪 98.2 | 25 |
| 4-ANPP | 281.2 🡪 188.1 | 15 |
| Norcarfentanil | 291.2 🡪 113.2 | 25 |
| Acetyl fentanyl | 323.2 🡪 188.1 | 30 |
| U-47700 | 329.2 🡪 204.0 | 35 |
| Acryl fentanyl | 335.2 🡪 188.1 | 30 |
| Fentanyl | 337.2 🡪 188.1 | 25 |
| Fentanyl-D5 | 342.2 🡪 188.1 | 25 |
| Butyryl fentanyl | 351.2 🡪 188.1 | 32 |
| cis-3-Methyl fentanyl | 351.2 🡪 202.2 | 32 |
| Furanyl fentanyl | 375.2 🡪 188.2 | 30 |
| Carfentanyl | 395.2 🡪 246.0 | 22 |
Results and Discussion
Precision
Spiked samples around the decision point and blank solutions are used to validate the precision of the method. Each concentration must not exceed 20% CV and the mean concentration ± 2 times the standard deviation must not overlap with other concentrations at the decision point. The peak area against the internal standard (IS) ratio was used to normalize the signal. Replicate extractions are deposited on a LazWell™ plate and dried before analysis. No overlapping at the decision point is observed for all curves and the CV% was below 15% for intra-run experiments. Results using the ± 2 STD overlay are plotted at Figure 3. The results of intra-run test for Fentanyl allow a cut-off value of 1 ng/mL in urine. All cut-offs of different drugs are determined this way.
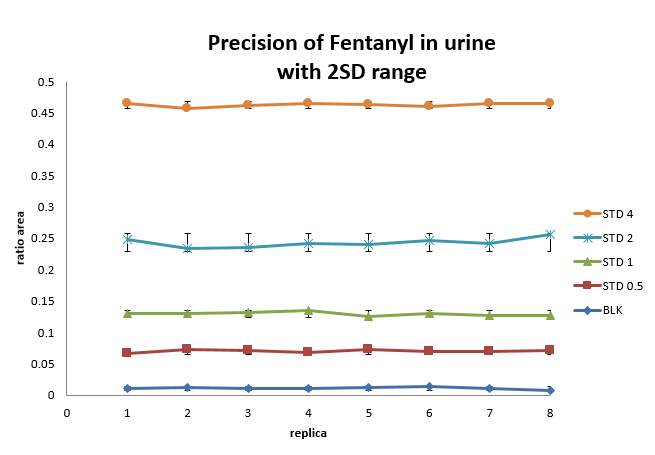
Figure 3 – Intra-Run Precision Curves for Fentanyl
For the inter-run precision experiment, each fortified sample sets are analyzed in triplicate on five different days. Table 2 shows the inter-run precision results.
| Grand mean (ng/mL) |
Grand mean – 2SD |
Grand mean + 2SD |
Grand mean (ng/mL) |
Grand mean – 2SD |
Grand mean + 2SD |
||
|---|---|---|---|---|---|---|---|
| 4-ANPP (ng/mL) | Cis-3-methyl fentanyl (ng/mL) | ||||||
| 1 | 1.027 | 0.902 | 1.153 | 0.25 | 0.226 | 0.216 | 0.236 |
| 2 | 2.106 | 1.929 | 2.284 | 0.5 | 0.515 | 0.502 | 0.527 |
| 4 | 3.973 | 3.590 | 4.355 | 1 | 1.046 | 0.996 | 1.097 |
| Acetyl fentanyl (ng/mL) | Cis-3-Methyl norfentanyl (ng/mL) | ||||||
| 0.25 | 0.239 | 0.222 | 0.256 | 0.5 | 0.501 | 0.460 | 0.542 |
| 0.5 | 0.508 | 0.473 | 0.542 | 1 | 1.036 | 0.956 | 1.117 |
| 1 | 1.021 | 0.964 | 1.079 | 2 | 1.979 | 1.818 | 2.139 |
| Acetyl Norfentanyl (ng/mL) | Fentanyl (ng/mL) | ||||||
| 2.5 | 2.463 | 2.013 | 2.914 | 0.5 | 0.477 | 0.421 | 0.532 |
| 5 | 5.192 | 4.695 | 5.689 | 1 | 1.010 | 0.931 | 1.090 |
| 10 | 9.991 | 9.391 | 10.591 | 2 | 2.048 | 1.940 | 2.156 |
| Acryl fentanyl (ng/mL) | Furanyl fentanyl (ng/mL) | ||||||
| 0.25 | 0.237 | 0.220 | 0.253 | 0.25 | 0.243 | 0.220 | 0.266 |
| 0.5 | 0.506 | 0.475 | 0.536 | 0.5 | 0.497 | 0.464 | 0.531 |
| 1 | 1.031 | 0.971 | 1.091 | 1 | 1.016 | 0.943 | 1.089 |
| Butyryl fentanyl (ng/mL) | Norcarfentanyl (ng/mL) | ||||||
| 0.25 | 0.234 | 0.226 | 0.241 | 1 | 0.993 | 0.872 | 1.115 |
| 0.5 | 0.508 | 0.488 | 0.528 | 2 | 2.046 | 1.855 | 2.237 |
| 1 | 1.031 | 0.991 | 1.071 | 4 | 4.052 | 3.621 | 4.484 |
| Butyryl norfentanyl (ng/mL) | Norfentanyl (ng/mL) | ||||||
| 2.5 | 2.419 | 1.811 | 3.027 | 0.5 | 0.481 | 0.412 | 0.551 |
| 5 | 5.081 | 4.693 | 5.470 | 1 | 1.033 | 0.912 | 1.154 |
| 10 | 10.080 | 9.549 | 10.611 | 2 | 2.048 | 1.866 | 2.231 |
| Carfentanyl (ng/mL) | U-47700 (ng/mL) | ||||||
| 0.25 | 0.256 | 0.230 | 0.281 | 2.5 | 2.436 | 2.168 | 2.704 |
| 0.5 | 0.500 | 0.452 | 0.547 | 5 | 5.079 | 4.664 | 5.494 |
| 1 | 0.996 | 0.935 | 1.057 | 10 | 10.158 | 9.120 | 11.197 |
Linearity
Blank urine sample is spiked to get different concentration to generate a calibration curve. Table 3 shows the inter-day correlation coefficients for all drugs. Values greater than 0.99 are obtained for all drugs. Figure 4 shows typical calibration curve results for Fentanyl.
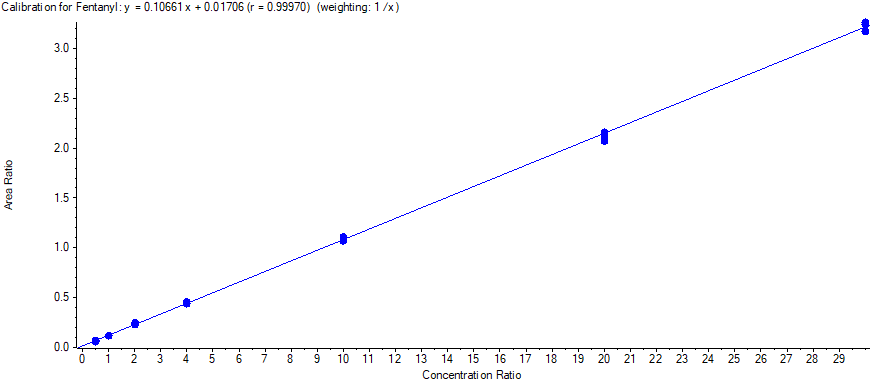
Figure 4 – Standard Curve for Fentanyl
| Curve 1 | Curve 2 | Curve 3 | Curve 4 | Curve 5 | |
|---|---|---|---|---|---|
| 4-ANPP | 0.99914 | 0.99919 | 0.99942 | 0.99905 | 0.99663 |
| Acetyl fentanyl | 0.99966 | 0.99977 | 0.99944 | 0.99986 | 0.99980 |
| Acetyl Norfentanyl | 0.99902 | 0.99990 | 0.99961 | 0.99912 | 0.99925 |
| Acryl fentanyl | 0.99972 | 0.99972 | 0.99988 | 0.99983 | 0.99973 |
| Butyryl fentanyl | 0.99907 | 0.99902 | 0.99929 | 0.99930 | 0.99916 |
| Butyryl norfentanyl | 0.99958 | 0.99941 | 0.99940 | 0.99914 | 0.99948 |
| Carfentanyl | 0.99938 | 0.99962 | 0.99951 | 0.99957 | 0.99973 |
| cis-3-Methyl fentanyl | 0.99859 | 0.99885 | 0.99988 | 0.99923 | 0.99763 |
| cis-3-Methyl norfentanyl | 0.99931 | 0.99888 | 0.99945 | 0.99939 | 0.99898 |
| Fentanyl | 0.99977 | 0.99970 | 0.99970 | 0.99980 | 0.99973 |
| Furanyl fentanyl | 0.99976 | 0.99957 | 0.99925 | 0.99939 | 0.99958 |
| Norcarfentanil | 0.99822 | 0.99894 | 0.99855 | 0.99875 | 0.99748 |
| Norfentanyl | 0.99748 | 0.99901 | 0.99946 | 0.99946 | 0.99853 |
| U-47700 | 0.99895 | 0.99965 | 0.99962 | 0.99962 | 0.99759 |
Wet Stability of Sample Extracts
Following the extraction, sample extracts are kept at 4°C in closed containers. After 4 days, sample extracts were spotted on a LazWell™ plate and analyzed. Precision at 50% cut-off standard is reported in Table 4 for Fentanyl. All the results are within the acceptable range (criteria %CV ≤20%) for 4 days at 4°C. Similar results are obtained for the other drugs.
Dry Stability of Samples Spotted in LazWell™
Extracted samples are spotted onto a LazWell™ plate and kept at room temperature before analysis. Precision at 50% cut-off standard is reported in Table 4 for Fentanyl. All the results are within the acceptable range (criteria %CV ≤20%) for 2 hours at room temperature. Similar results are obtained for the other drugs.
| Parameters | Dry stability | Wet stability |
|---|---|---|
| Time | 2 hours | 4 days |
| Temp. (°C) | 22 | 4°C |
| Conc. (ng/mL) | 0.5 | 0.5 |
| N | 3 | 3 |
| Mean (ng/mL) | 0.473 | 0.489 |
| %CV | 4.8 | 7.1 |
Conclusion
Luxon Ion Source® combined to Sciex Q-Trap 5500 mass spectrometer system allows ultra-fast (8 seconds per sample) screening of illicitly manufactured fentanyl (IMF) and its analogue drugs in urine sample using a simple generic sample preparation method.