Introduction
In various industrial production plants, workers can be exposed to organic compounds like toluene, xylene and styrene. The chronic exposure to these compounds has been linked to severe impacts on the central nervous system. The measurement of their major metabolites in urine would provide an important indication of the overall level of occupational exposure to these widely used compounds. Toluene, xylene and styrene are metabolized and excreted in the urine as hippuric acid (HA), methylhippuric acids (MHA) and mandelic acid (MA), respectively.
Our goal for this application note is to use an automated sample preparation method for the simultaneous quantification of creatinine, hippuric acid, methylhippuric acid and mandelic acid in urine using a single operation in LDTD-MS/MS for workers that may be victims of toluene, xylene and styrene exposure.
LDTD-MS/MS offers specificity combined with an ultra-fast analysis for an unrivaled screening method. To develop this application, we focused on performing a quick and simple sample preparation. Metabolites are analyzed simultaneously with quantitative screening results obtained in less than 8 seconds per sample. Each metabolite has been screened based on the WHO (World Health Organization) detection range.
Sample Preparation Method
Sample Collection
Urine samples were collected and transferred into barcoded tubes, readable by the Azeo extraction system.
Automated Sample Extraction
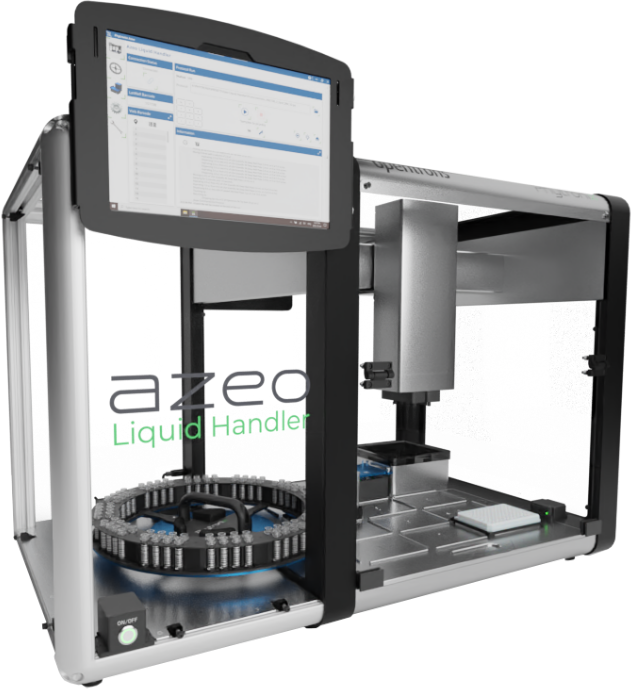
Each barcoded vial was scanned by the Azeo Liquid Handler and an automatic batch file was created. The Azeo extraction system (Figure 3) is used to extract the samples using the following conditions:
- 20 µL of urine sample were transferred from the vials to a deep-well plate placed in the Lumo Vortexer
- 300 µL of Internal standard were added to each sample.
- Mix
- 300 µL of Dilution buffer and 2.5 µL urine/internal standard mixtures were added into a deep-well plate.
- Mix
- Spot 2.5 µL final dilution onto a LazWell™96 plate
- Dry 3 minutes at 40°C in the Aura LazWell Dryer
LDTD®-MS/MS Parameters
LDTD
Model: Luxon S-960, Phytronix
Carrier gas: 6 L/min (air)
Laser pattern:
- 3-second ramp to 65% power
- Hold 2 seconds at 65% power
MS/MS
MS model: Q-Trap System® 5500, Sciex
Scan Time: 25 msec
Total run time: 8 seconds per sample
Ionization: APCI
Analysis Method: Negative MRM mode
Table 1 – MRM transitions for LDTD-MS/MS
| Transition | CE | |
|---|---|---|
| Creatinine | 112 → 68 | -32 |
| Creatinine-d3 | 115 → 68 | -32 |
| Mandelic acid | 151 → 107 | -15 |
| Hippuric acid | 178 → 134 | -25 |
| Hippuric acid-d5 | 183 → 139 | -25 |
| Methylhippuric acid | 192 → 148 | -25 |
Results and Discussion
Screening range (µg/mL)
The screening range for each metabolite can be found in Table 2.
Table 2 – Metabolites Calibration Ranges
| Analyte | (µg/mL) |
|---|---|
| Creatinine | 200 – 4000 |
| Mandelic acid (MA) | 100 – 2000 |
| Hippuric acid (HA) | 100 – 2000 |
| Methylhippuric acid (MHA) | 100 – 2000 |
Validation Test
Calibration curves were prepared in a methanol:water (3:7) solution in which the calibration curve samples were diluted. Replicate extractions were deposited onto a LazWell™ plate and dried before analysis. The peak area against the internal standard (IS) ratio was used to normalize the signal.
Linearity
The calibration curves were plotted using the peak area ratio and the nominal concentration of standards. For the linearity test, the following acceptance criteria was used:
- Linear regression (r) must be ≥ 995
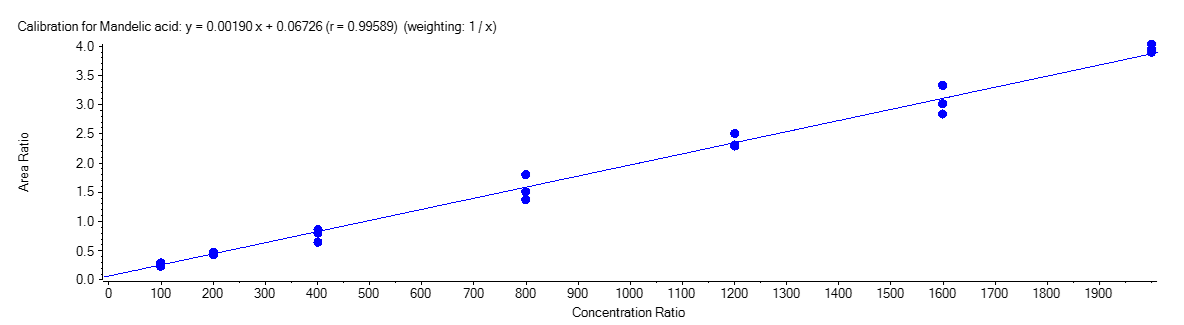
Mandelic Acid
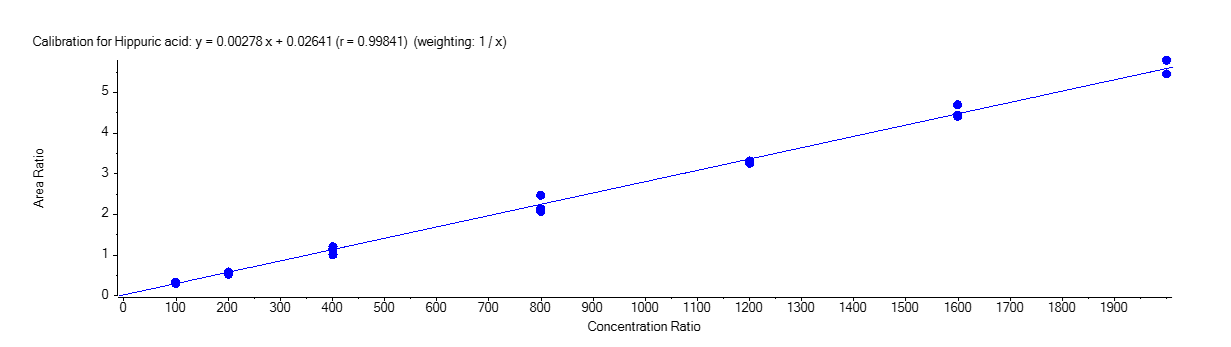
Hippuric Acid
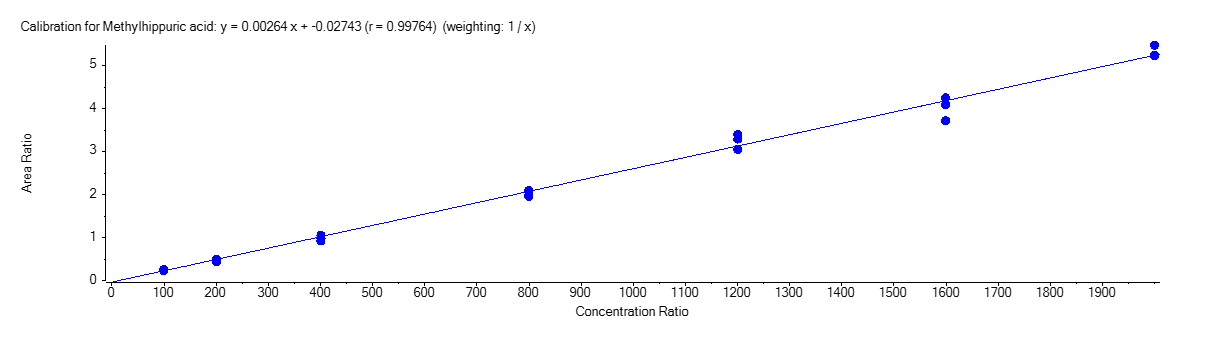
Methylhippuric Acid
Creatinine
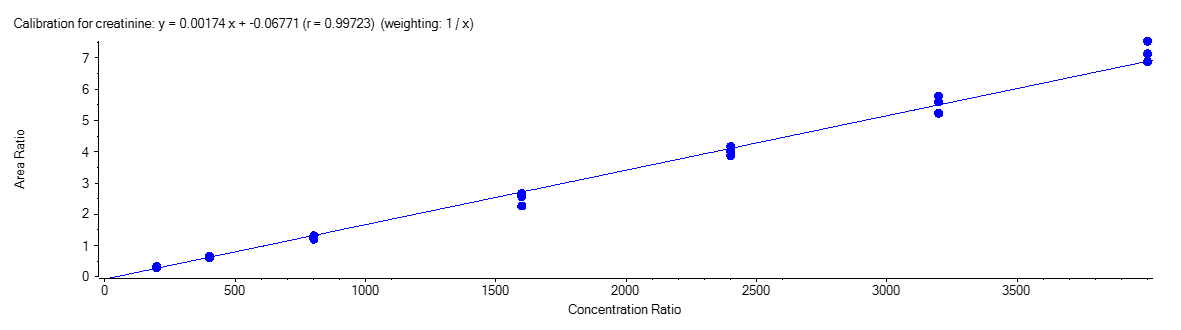
Figure 4 shows the calibration curve for MA (A), HA (B), MHA (C) and creatinine (D).
Precision and Accuracy
For the accuracy and precision evaluation, the following acceptance criteria were used:
- Each concentration must not exceed 15% CV.
- Each concentration must be within 100 ± 15% of the nominal concentration.
For the inter-run precision and accuracy experiment, each standard was analyzed in triplicate, on three different days. Table 3 shows the inter-run precision and accuracy results for Hippuric acid. The obtained %CV was below 15% and the accuracy was within 15% of nominal value. Similar results were obtained for the other metabolites.
Table 3 – Inter-Run Precision and Accuracy of Hippuric Acid
| Hippuric acid | S1 | S2 | S3 | S4 | S5 | S6 | S7 |
|---|---|---|---|---|---|---|---|
| Conc (µg/mL) | 100 | 200 | 400 | 800 | 1200 | 1600 | 2000 |
| N | 9 | 9 | 9 | 9 | 9 | 9 | 9 |
| Mean (µg/mL) | 107 | 190 | 397 | 792 | 1169 | 1613 | 2033 |
| SD | 8,2 | 9,4 | 32,8 | 74,8 | 11,1 | 53,9 | 69 |
| %CV | 7,7 | 4,9 | 8,3 | 9,4 | 1,0 | 3,3 | 3,4 |
| %Nom | 106,9 | 95,2 | 99,1 | 99,0 | 97,4 | 100,8 | 101,6 |
Multi-Matrix Evaluation
Urine samples were collected from six volunteers. Samples were screened to verify the endogenic value of each metabolite. To study the matrix effect, urine samples were spiked with metabolites at final concentration addition of 667 µg/mL. Table 4 shows the screening results of all metabolites. An addition of 667 µg/mL was obtained for each matrix within ± 15% of nominal value.
Table 4 – Multi-Matrix Evaluation Results
| Sample | MA Endo (µg/mL) |
MA Spike (µg/mL) |
HA Endo (µg/mL) |
HA Spike (µg/mL) |
MHA Endo (µg/mL) |
MHA Spike (µg/mL) |
Creatinine (µg/mL) |
|---|---|---|---|---|---|---|---|
| U1 | 179 | 942 | 220 | 962 | 21 | 776 | 1657 |
| U2 | 137 | 872 | 75 | 746 | 75 | 699 | 2129 |
| U3 | 89 | 802 | 96 | 755 | 26 | 599 | 1413 |
| U4 | 116 | 857 | 418 | 1101 | 22 | 642 | 772 |
| U5 | 179 | 928 | 114 | 802 | 28 | 622 | 1240 |
| U6 | 38 | 755 | 152 | 780 | 23 | 603 | 647 |
Conclusion
The Luxon Ion Source combined with Sciex Q-Trap 5500 mass spectrometer system allows ultra-fast (8 seconds per sample) analysis of the urine metabolites of toluene, xylene and styrene. This method allows the quantification of urine diluted biomarkers and creatinine, simultaneously.