Introduction
Neuroleptics, also known as antipsychotic medication, are used to treat and manage symptoms of many psychiatric disorders. They can be divided into two classes: first-generation or “typical” antipsychotics and second-generation or “atypical” antipsychotics. Both generations of medication tend to block receptors in the brain’s dopamine pathways, but atypical tend to act on serotonin receptors as well. To increase the analysis throughput of plasma samples, the Luxon Ion Source® coupled to tandem mass spectrometry (MS/MS) was used for the quantification of neuroleptic drugs.
For this project, we propose to perform a generic extraction method for neuroleptic drug analysis in plasma. Quantification using the Luxon coupled to a mass spectrometer (Luxon-MS/MS) is chosen as a fast-analytical technique.
Luxon Ionization Source
The Luxon Ion Source® (Figure 1) is the second-generation sample introduction and ionization source based on the LDTD® technology for mass spectrometry. Luxon Ion Source® uses Fiber-Coupled Laser Diode (Figure 2) to obtain unmatchable thermal uniformity giving more precision, accuracy and speed. The process begins with dry samples which are rapidly evaporated using indirect heat. The thermally desorbed neutral molecules are carried into a corona discharge region. High-efficiency protonation and strong resistance to ionic suppression characterize this type of ionization and is the result of the absence of solvent and mobile phase. This thermal desorption process yields high-intensity molecular ion signal in less than 1 second sample-to-sample and allows working with very small volumes.
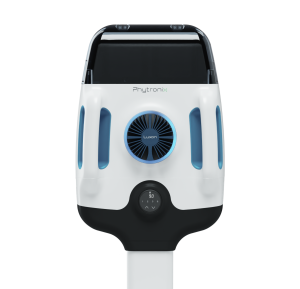
Figure 1 – Luxon Ion Source®
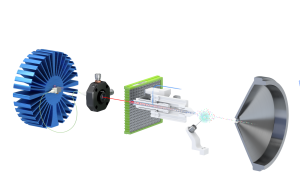
Figure 2 – Schematic of the Luxon Ionization Source
Sample Preparation Method
Neuroleptics multilevel plasma calibrator set from Chromsystems™ containing the following drugs is used: Aripiprazole, Dehydroaripiprazole, Clozapine, Desmethylclozapine, Haloperidol, Olanzapine N-desmethylolanzapine, Quetiapine, Norquetiapine, Risperidone and 9-Hydroxyrisperidone. These are used as calibration standards. Control Level I and Level II from Chromsystems™ are used as quality control samples.
Protein precipitation is performed by mixing 20 µL plasma, 4 µL internal standard solution and 200 µL acetonitrile. Vortex and centrifuge at 14000 rpm for 1 minute. Finally, 5 µL of the upper layer are spotted into 96-LazWell-DEC™ plates and evaporated to dryness. Luxon-MS/MS analysis is performed after a complete evaporation.
LDTD-MS/MS Parameters
LDTD
Model: Phytronix, Luxon S-960
Carrier gas: 6 L/min (air)
Laser pattern: 6 second ramp to 65% power and hold 2 seconds.
MS/MS
Model: Q-Trap System® 5500, Sciex
Ionization: APCI (Positive)
| Sulfonamides | Transition | CE |
|---|---|---|
| Norquetiapine | 296 → 253 | 31 |
| N-Desmethylolanzapine | 299 → 213 | 35 |
| Desmethylclozapine | 313 → 192 | 55 |
| Olanzapine | 313 → 256 | 31 |
| Clozapine | 327 → 270 | 32 |
| Clozapine-D 8 | 335 → 275 | 32 |
| Haloperidol | 376 → 165 | 25 |
| Quetiapine | 384 → 253 | 33 |
| Quetiapine-D 8 | 392 → 258 | 33 |
| Risperidone | 411 → 110 | 60 |
| 9-Hydroxyrisperidone | 427 → 207 | 35 |
| 9-Hydroxyrisperidone-D 4 | 431 → 211 | 35 |
| Dehydroaripiprazole | 446 → 285 | 22 |
| Aripiprazole | 448 → 285 | 22 |
Results and Discussion
Linearity
Calibrator set spiked at the following calibration ranges are extracted: 20.6 to 746 µg/L for Aripiprazole, 7.56 to 273 µg/L for Dehydroaripiprazole, 77.7 to 1149 µg/L Clozapine, 75.1 to 453 µg/L for Desmethylclozapine, 2.03 to 30.03 µg/L for Haloperidol, 3.85 to 153 µg/L for Olanzapine, 3.92 to 160 µg/L for N-Desmethylolanzapine, 27.3 to 525 µg/L for Quetiapine, 11 to221 µg/L for Norquetiapine, 2.04 to 30.7 µg/L for Risperidone and 3.68 to 138 µg/L for 9-Hydroxyrisperidone. Correlation coefficients are equal or greater than 0.99 (Table 2) for the quantification curve of each molecule. Figure 3 shows the calibration curve of Clonidine. Similar results are obtained for the other Neuroleptic drugs. Figure 4 shows the typical desorption peak of Clonidine with a 0.16-minute window.
| Drug | Equation | R |
|---|---|---|
| Norquetiapine | Y = 0.01130 X + 0.00782 | 0.99585 |
| N-Desmethylolanzapine | Y = 2.01659•10-4 X + 9.92306•10-4 | 0.99597 |
| Desmethylclozapine | Y = 0.00108 X + 0.00458 | 0.99396 |
| Olanzapine | Y = 0.00262 X + 4.56504•10-4 | 0.99875 |
| Clozapine | Y = 0.00619 X – 7.80539•10-4 | 0.99914 |
| Haloperidol | Y = 0.06161 X + 0.02704 | 0.99876 |
| Quetiapine | Y = 0.11178 X – 0.03033 | 0.99925 |
| Risperidone | Y = 0.00888 X + 0.03699 | 0.99452 |
| 9-Hydroxyrisperidone | Y = 0.08996 X + 0.02258 | 0.99980 |
| Dehydroaripiprazole | Y = 0.01801 X + 0.00193 | 0.99347 |
| Aripiprazole | Y = 0.00484 X + 0.03608 | 0.99844 |
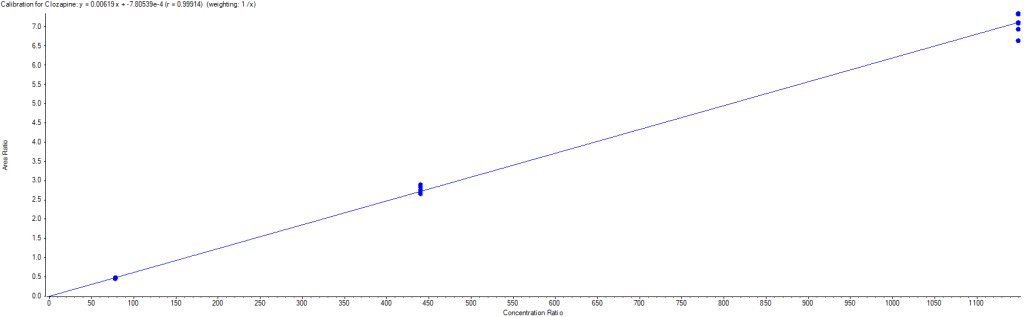
Figure 3 – Clozapine calibration curve
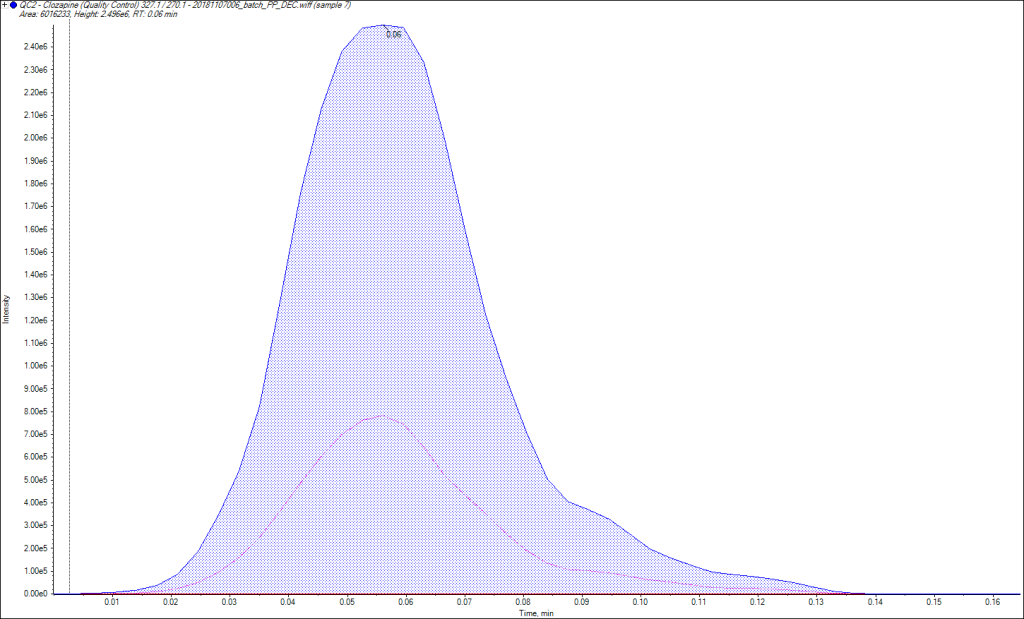
Figure 4 – Clozapine desorption peak
Precision and accuracy
Replicate extractions of control Level I and II are deposited on a LazWell™ plate and dried before analysis. Six replicas are analyzed for within-run evaluation. CV% was below 15% and accuracy within ±20% of the nominal concentration is reached. Table 3 shows the intra-run precision/accuracy results.
For the inter-run precision/accuracy experiment, each control sample sets are analyzed in sextuplicate on three different days. Table 3 shows the inter-run precision/accuracy results.
| Intra run | Inter-un | |||
|---|---|---|---|---|
| Norquetiapine | Level I | Level II | Level I | Level II |
| Conc. (µg/L) | 53.4 | 93.6 | 53.4 | 93.6 |
| N | 6 | 6 | 18 | 18 |
| Mean (µg/L) | 60.5 | 95.1 | 60.6 | 103.8 |
| %CV | 6.1 | 9.2 | 8.0 | 13.2 |
| %NOM | 113.3 | 101.6 | 113.5 | 110.9 |
| N-DesmethylOlanzapine | Level I | Level II | Level I | Level II |
| Conc. (µg/L) | 35.9 | 61.6 | 35.9 | 61.6 |
| N | 6 | 6 | 18 | 18 |
| Mean (µg/L) | 40.4 | 67.5 | 41.3 | 71.4 |
| %CV | 6.6 | 9.0 | 8.1 | 12.5 |
| %NOM | 112.6 | 109.6 | 115.1 | 115.9 |
| DesmethylClozapine | Level I | Level II | Level I | Level II |
| Conc. (µg/L) | 171 | 234 | 171 | 234 |
| N | 6 | 6 | 18 | 18 |
| Mean (µg/L) | 173.2 | 237.1 | 169.7 | 230.7 |
| %CV | 8.4 | 6.4 | 8.5 | 13.9 |
| %NOM | 101.3 | 101.3 | 99.3 | 98.6 |
| Olanzapine | Level I | Level II | Level I | Level II |
| Conc. (µg/L) | 34.9 | 63.6 | 34.9 | 63.6 |
| N | 6 | 6 | 18 | 18 |
| Mean (µg/L) | 40.7 | 68.5 | 41.3 | 71.4 |
| %CV | 2.6 | 9.5 | 7.3 | 10.3 |
| %NOM | 116.6 | 107.7 | 118.2 | 112.2 |
| Clozapine | Level I | Level II | Level I | Level II |
| Conc. (µg/L) | 337 | 567 | 337 | 567 |
| N | 6 | 6 | 18 | 18 |
| Mean (µg/L) | 352.0 | 565.2 | 355.9 | 576.1 |
| %CV | 3.5 | 2.3 | 3.2 | 4.5 |
| %NOM | 104.5 | 99.7 | 105.6 | 101.6 |
| Haloperidol | Level I | Level II | Level I | Level II |
| Conc. (µg/L) | 3.7 | 15.7 | 3.7 | 15.7 |
| N | 6 | 6 | 18.0 | 18.0 |
| Mean (µg/L) | 4.3 | 18.4 | 4.4 | 18.5 |
| %CV | 4.5 | 5.5 | 5.2 | 5.6 |
| %NOM | 116.2 | 117.2 | 118.7 | 117.7 |
| Quetapine | Level I | Level II | Level I | Level II |
| Conc. (µg/L) | 147 | 256 | 147 | 256 |
| N | 6 | 6 | 18 | 18 |
| Mean (µg/L) | 152.5 | 251.3 | 153.7 | 258.0 |
| %CV | 3.5 | 3.3 | 3.2 | 5.6 |
| %NOM | 103.7 | 98.2 | 104.6 | 100.8 |
| Risperidone | Level I | Level II | Level I | Level II |
| Conc. (µg/L) | 9.17 | 14.3 | 9.17 | 14.3 |
| N | 6 | 6 | 18 | 18 |
| Mean (µg/L) | 9.4 | 14.0 | 10.1 | 14.6 |
| %CV | 11.8 | 11.9 | 12.2 | 11.7 |
| %NOM | 102.5 | 97.9 | 110.2 | 102.4 |
| 9-Hydroxyrisperidone | Level I | Level II | Level I | Level II |
| Conc. (µg/L) | 35.8 | 64.2 | 35.8 | 64.2 |
| N | 6 | 6 | 18 | 18 |
| Mean (µg/L) | 36.1 | 61.4 | 36.4 | 63.5 |
| %CV | 1.7 | 2.7 | 3.8 | 6.5 |
| %NOM | 100.8 | 95.6 | 101.6 | 99.0 |
| Dehydroaripiprazole | Level I | Level II | Level I | Level II |
| Conc. (µg/L) | 64.2 | 116 | 64.2 | 116.0 |
| N | 6 | 6 | 18.0 | 18.0 |
| Mean (µg/L) | 70.2 | 124.6 | 67.1 | 120.4 |
| %CV | 7.4 | 11.1 | 8.8 | 9.0 |
| %NOM | 109.3 | 107.4 | 104.5 | 103.8 |
| Aripiprazole | Level I | Level II | Level I | Level II |
| Conc. (µg/L) | 172 | 314 | 172 | 314 |
| N | 6 | 6 | 18 | 18 |
| Mean (µg/L) | 194.1 | 346.2 | 193.1 | 349.0 |
| %CV | 6.5 | 4.4 | 7.6 | 10.6 |
| %NOM | 112.8 | 110.3 | 112.2 | 111.2 |
Conclusion
Luxon Ion Source® combined to Q-Trap 5500 mass spectrometer system allows ultra-fast (10 seconds per sample) quantification of neuroleptic drugs in plasma using a generic protein precipitation extraction procedure.