Introduction
Perfluoroalkyl and polyfluoroalkyl substances (PFAS) are a group of chemicals made by humans. Since the 1950s, PFASs have been used in many consumer products and industrial processes. They have properties that resist heat, grease, and water. There are thousands of types of PFAS. The most common types and final products of degradation are PFOA (perfluorooctanoic acid) and PFOS (perfluorooctanoic sulfonic acid). They were widely detected in different environmental media (Mahiba Shoeib et al. 2005) and human blood (Perez et al. 2013). PFAS in drinking water is one of the most concerning aspects.
The goal of this application note is to develop an automated sample preparation of drinking water samples and a rapid analytical method to analyze PFAS using LDTD-MS/MS.
Sample Preparation Method
Automated Sample Extraction
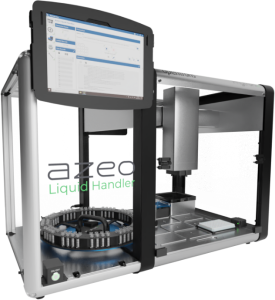
Two milliliters of drinking water samples are transferred to a borosilicate tube (12X75 mm) then inserted in the Azeo extraction system (Figure 1). The automated extraction process is as follows:
- Add 20 µL of internal standard solution.
- Vortex (1100 rpm/30 s)
- Add 30 µL of HCl (4N).
- Vortex (1100 rpm/30 s)
- Add 700 µL of extraction solution (MTBE).
- Vortex (1100 rpm/30 s)
- Phase separation by gravity
- In a sample holder of 96 glass tubes (6X31 mm), add 50 µL ammonium formate (20 mM in methanol).
- Transfer 200 µL of the upper layer into the 6X31 mm glass tube.
- Vortex (1100 rpm/30 s)
- Evaporate until dryness (40°C, 10 minutes, air flow 10 LPM).
- Add 60 µL of reconstitution solution.
- Vortex (1100 rpm/30 s)
- Spot 5 µL of reconstituted sample on a LazWell™96 plate.
- Dry 5 minutes at 40°C.
LDTD®-MS/MS Parameters
LDTD
Model: Luxon T-960 NG, Phytronix
Carrier gas: 9 L/min (Nitrogen) + 7.5 µL/min TFA solution (0.05% in water)
Laser pattern:
- 6-second ramp to 100% power
- 4-second hold at 100% power
MS/MS
MS model: TSQ Altis plus, Thermo Scientific
IonSpray Voltage: -3800 V
Scan Time: 5 msec
Analysis Method: Negative MRM mode
| Transition | CE (V) | |
|---|---|---|
| PFBA | 327.0 → 169.0 | 20 |
| PFBA-M3 | 330.0 → 172.0 | 20 |
| HFPO-DA | 443.0 → 169.0 | 20 |
| HFPO-DA-M3 | 446.0 → 172.0 | 20 |
| PFBS | 451.0 → 299.0 | 20 |
| PFBS-M4 | 455.0 → 303.0 | 20 |
| PFHxA | 427.0 → 269.0 | 20 |
| PFHxA-M6 | 433.0 → 274.0 | 20 |
| PFHxS | 551.0 → 399.0 | 20 |
| PFHxS-M6 | 557.0 → 405.0 | 20 |
| PFOA | 527.0 → 412.8 | 8 |
| PFOA-M8 | 538.0 → 420.8 | 8 |
| 6:2 FTS | 579.0 → 427.0 | 24 |
| 6:2 FTS-M6 | 585.0 → 433.0 | 24 |
| PFNA | 577.0 → 463.0 | 8 |
| PFNA-M6 | 583.0 → 469.0 | 8 |
| PFOS | 651.0 → 499.0 | 20 |
| PFOS-M8 | 659.0 → 507.0 | 20 |
Results and Discussion
Linearity
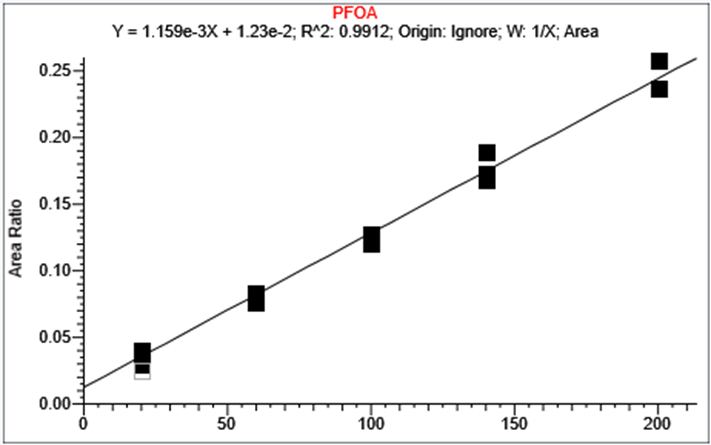
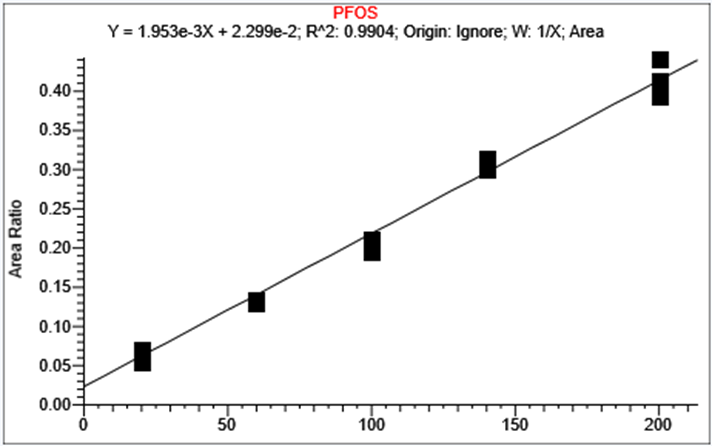
The calibration curve is prepared in HPLC water. PFAS concentration between 20 to 200 ng/L are used to evaluate the method linearity and 100 to 10 000 ng/L for PFBA. The peak area against the internal standard (IS) ratio was used to normalize the signal. Replicate extractions are deposited on a LazWell™ plate and dried before analysis. Figure 4 and Figure 5 shows a typical calibration curve for PFOA and PFOS. Similar results were obtained for the other PFAS.
Precision and Accuracy
Spiked sample solutions are used to validate the precision and accuracy of the method. For the accuracy and precision evaluation, the following acceptance criteria were used:
- Each concentration must not exceed <20% CV.
- Each concentration must be within ± 20% Bias.
For the intra and inter-run precision and accuracy experiment, each fortified sample set is analyzed in sextuplicate, in the same runs. Table 1 shows the intra-run precision and accuracy results for PFOA. %CV was below 20% and the accuracy within 20%. Similar results were obtained for the other PFAS.
| PFOA | Cal-1 | Cal-2 | Cal-3 | Cal-4 | Cal-5 |
|---|---|---|---|---|---|
| Conc (ng/L) | 20 | 60 | 100 | 140 | 200 |
| N | 3 | 3 | 3 | 3 | 3 |
| Mean (ng/L) | 18.2 | 68.7 | 85.6 | 154.5 | 195.4 |
| %CV | 16.6 | 5.9 | 10.7 | 11.0 | 2.9 |
| %Nom | 91.2 | 114.5 | 85.6 | 110.3 | 97.7 |
For the inter-run precision experiment, each fortified sample set is analyzed in triplicate on three different runs. Table 2 shows the inter-run precision and accuracy results for PFOA. %CV was below 20% and the accuracy within 20%. Similar results were obtained for the other PFAS.
| PFOA | Cal-1 | Cal-2 | Cal-3 | Cal-4 | Cal-5 |
|---|---|---|---|---|---|
| Conc (ng/L) | 20 | 60 | 100 | 140 | 200 |
| N | 9 | 9 | 9 | 9 | 9 |
| Mean (ng/L) | 18.0 | 65.6 | 91.7 | 148.6 | 198.6 |
| %CV | 19.3 | 9.6 | 9.3 | 9.4 | 3.5 |
| %Nom | 90.0 | 109.4 | 91.7 | 106.2 | 99.3 |
Recovery
Blank samples were extracted and then spiked at the middle calibration level after the automated extraction process. The middle standard was compared to the recovery sample to determine the recovery percentage of PFAS. Table 3 shows the recovery results.
| PFAS | Recovery |
|---|---|
| PFBA | 72.3 |
| HFPO-DA | 71.4 |
| PFBS | 42.7 |
| PFHxA | 77.1 |
| PFHxS | 78.1 |
| PFOA | 78.8 |
| 6:2 FTS | 72.6 |
| PFNA | 81.8 |
| PFOS | 87.0 |
Multi-matrix analysis of PFAS in drinking water
Drinking water was collected from different sites. Samples are analyzed to verify the presence of each PFAS. PFAS are spiked at 100 ng/L (500 ng/L for PFBA) and analyzed as unknown to verify the method performance. Results are report in Table 4.
| Sample | PFOA Conc. (ng/L) |
PFOS Conc. (ng/L) |
PFNA Conc. (ng/L) |
PFHxS Conc. (ng/L) |
PFHxA Conc. (ng/L) |
PFBS Conc. (ng/L) |
PFBA Conc. (ng/L) |
HFPO-DA Conc. (ng/L) |
6:2-FTS Conc. (ng/L) |
|---|---|---|---|---|---|---|---|---|---|
| DW-1 | <20 | <20 | 33.6 | <20 | <20 | <20 | <100 | <20 | <20 |
| DW-1-100 | 118.2 | 108.9 | 143.6 | 110.3 | 122.1 | 124.7 | 514.6 | 99.4 | 130.4 |
| DW-2 | <20 | <20 | <20 | <20 | 28.4 | <20 | <100 | <20 | <20 |
| DW-2-100 | 115.4 | 105.3 | 113.6 | 105.5 | 120.1 | 108.1 | 548.6 | 98.4 | 102.7 |
| DW-3 | <20 | <20 | <20 | <20 | <20 | 21.2 | <100 | <20 | <20 |
| DW-3-100 | 97.0 | 99.1 | 112.6 | 103.6 | 105.3 | 123.0 | 492.2 | 88.5 | 107.3 |
| DW-4 | <20 | <20 | <20 | <20 | <20 | 26.8 | <100 | <20 | <20 |
| DW-4-100 | 101.4 | 102.9 | 106.7 | 103.1 | 112.4 | 111.2 | 547.9 | 109.5 | 116.7 |
| DW-5 | <20 | <20 | <20 | <20 | <20 | 28.1 | <100 | <20 | <20 |
| DW-5-100 | 95.5 | 101.8 | 108.9 | 102.7 | 117.1 | 118.0 | 512.7 | 117.4 | 116.4 |
| DW-6 | <20 | <20 | <20 | <20 | 35.0 | 26.5 | <100 | <20 | 27.7 |
| DW-6-100 | 112.0 | 101.3 | 121.6 | 102.3 | 133.2 | 117.8 | 501.9 | 112.6 | 125.1 |
Conclusion
Luxon Ion Source® combined with a Thermo Scientific TSQ Altis Plus mass spectrometer system allows ultra-fast (10 seconds per sample) analysis of a panel of PFAS in drinking water using a simple and automated sample preparation method.