Introduction
In forensic sciences, explosives analysis of swabbed surfaces is used in crime scene investigation. Jagerdeo et al1 report a rapid screening method for explosives analysis using LDTD® technology for forensic application. The Environmental Protection Agency (EPA) developed Method 8330B (SW-846) for the analysis of explosives in different matrices (water, soil or sediment) using a HPLC-UV method. Our goal for this application note is to develop an automated and fast screening tool for the analysis of explosives in soil samples using the Luxon Ion Source®, based on the LDTD technology.
LDTD-MS/MS offers specificity combined with an ultra-fast analysis for an unrivaled screening method. To develop this application, we adapted and automatized the EPA extraction method. Explosives are analyzed, and results are obtained in less than 8 seconds per sample.
Sample Preparation Method
Sample Collection
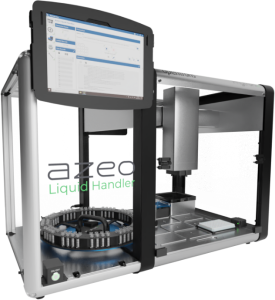
1 g of soil samples were transferred in 2 mL barcoded tubes and mixed with 1 mL of internal standard (ETN, 200 ng/mL in acetonitrile). After centrifugation, samples were transferred into the Azeo Liquid Handler (Figure 3).
Sample Extraction (SALLE) : Panel 1
Each barcoded vial was scanned by the Azeo Liquid Handler and an automatic batch file was created. The Azeo extraction system (Figure 3) is used to extract the samples using the following conditions:
- 200 µL of Ammonium chloride (5 mM in Methanol:Water / 75:25) were added to a deep-well plate placed on the Lumo Vortexer
- 100 µL of sample were transferred from the vials to the deep-well plate placed on the Lumo Vortexer
- Mix
- Spot 6 µL of the mixture on a LazWell™-DEC 96 plate
- Dry 4 minutes at 40 °C
Note: For a cleaner extract, a salt assisted liquid-liquid extraction (SALLE) can be used in this automated extraction process.
LDTD®-MS/MS Parameters
LDTD
Model: Luxon S-960, Phytronix
Carrier gas: 3.0 L/min (air)
Laser pattern:
- 6-second ramp to 65% power
- Hold 2 seconds at 65% power
MS/MS
MS model: QTrap® System 5500, Sciex
Curtain gas: 10
CAD: 6
IonSpray Voltage: 6000
Temperature, GS1 and GS2 set to zero
Scan Time: 20 msec
Ionization: APCI
Analysis Method: Negative MRM mode
| Explosives | Transition | CE |
|---|---|---|
| RDX | 257.0 → 46.0 | -30 |
| NG | 262.0 → 46.0 | -20 |
| Tetryl | 322.0 → 199.0 | -10 |
| HMX | 331.0 → 109.0 | -25 |
| ETN (IS) | 337.0 → 46.0 | -30 |
| PETN | 351.0 → 46.0 | -45 |
Results and Discussion
Screening Cut-Off Test (ppb)
Explosives list and screening cut-offs reached on the mass spectrometer used can be found in Table 2.
| Explosive | Cut-off (ppb) |
|---|---|
| HMX | 4 |
| RDX | 10 |
| PETN | 20 |
| Tetryl | 40 |
| NG | 100 |
Precision
Spiked samples around the decision point (50% cut-off: QC-L, cut-off: CO and 200% cut-off: QC-H) and blank solutions are used to validate the precision of the method. The peak area against the internal standard (IS) ratio was used to normalize the signal. Replicate extractions are deposited onto a LazWell™-DEC plate and dried before analysis.
The following acceptance criteria were used:
- Each concentration must not exceed 20% CV
- The mean concentration ± 2 times the standard deviation must not overlap with other concentrations at the cut-off.
For the inter-run precision experiment, each fortified sample set is analyzed in triplicate on five different days. Table 3 shows the inter-run precision results. No overlapping at the cut-off is observed for PETN and the %CV was below 20%. Similar results are obtained for the other explosives in the panel.
| PETN | QC-L | CO | QC-H |
|---|---|---|---|
| Conc (ppb) | 10 | 20 | 40 |
| N | 15 | 15 | 15 |
| Mean (ppb) | 9.3 | 19.2 | 39.5 |
| %CV | 10.6 | 9.4 | 7.2 |
| Mean – 2SD (ppb) | 7.4 | 15.6 | 33.8 |
| Mean + 2SD (ppb) | 11.3 | 22.8 | 45.2 |
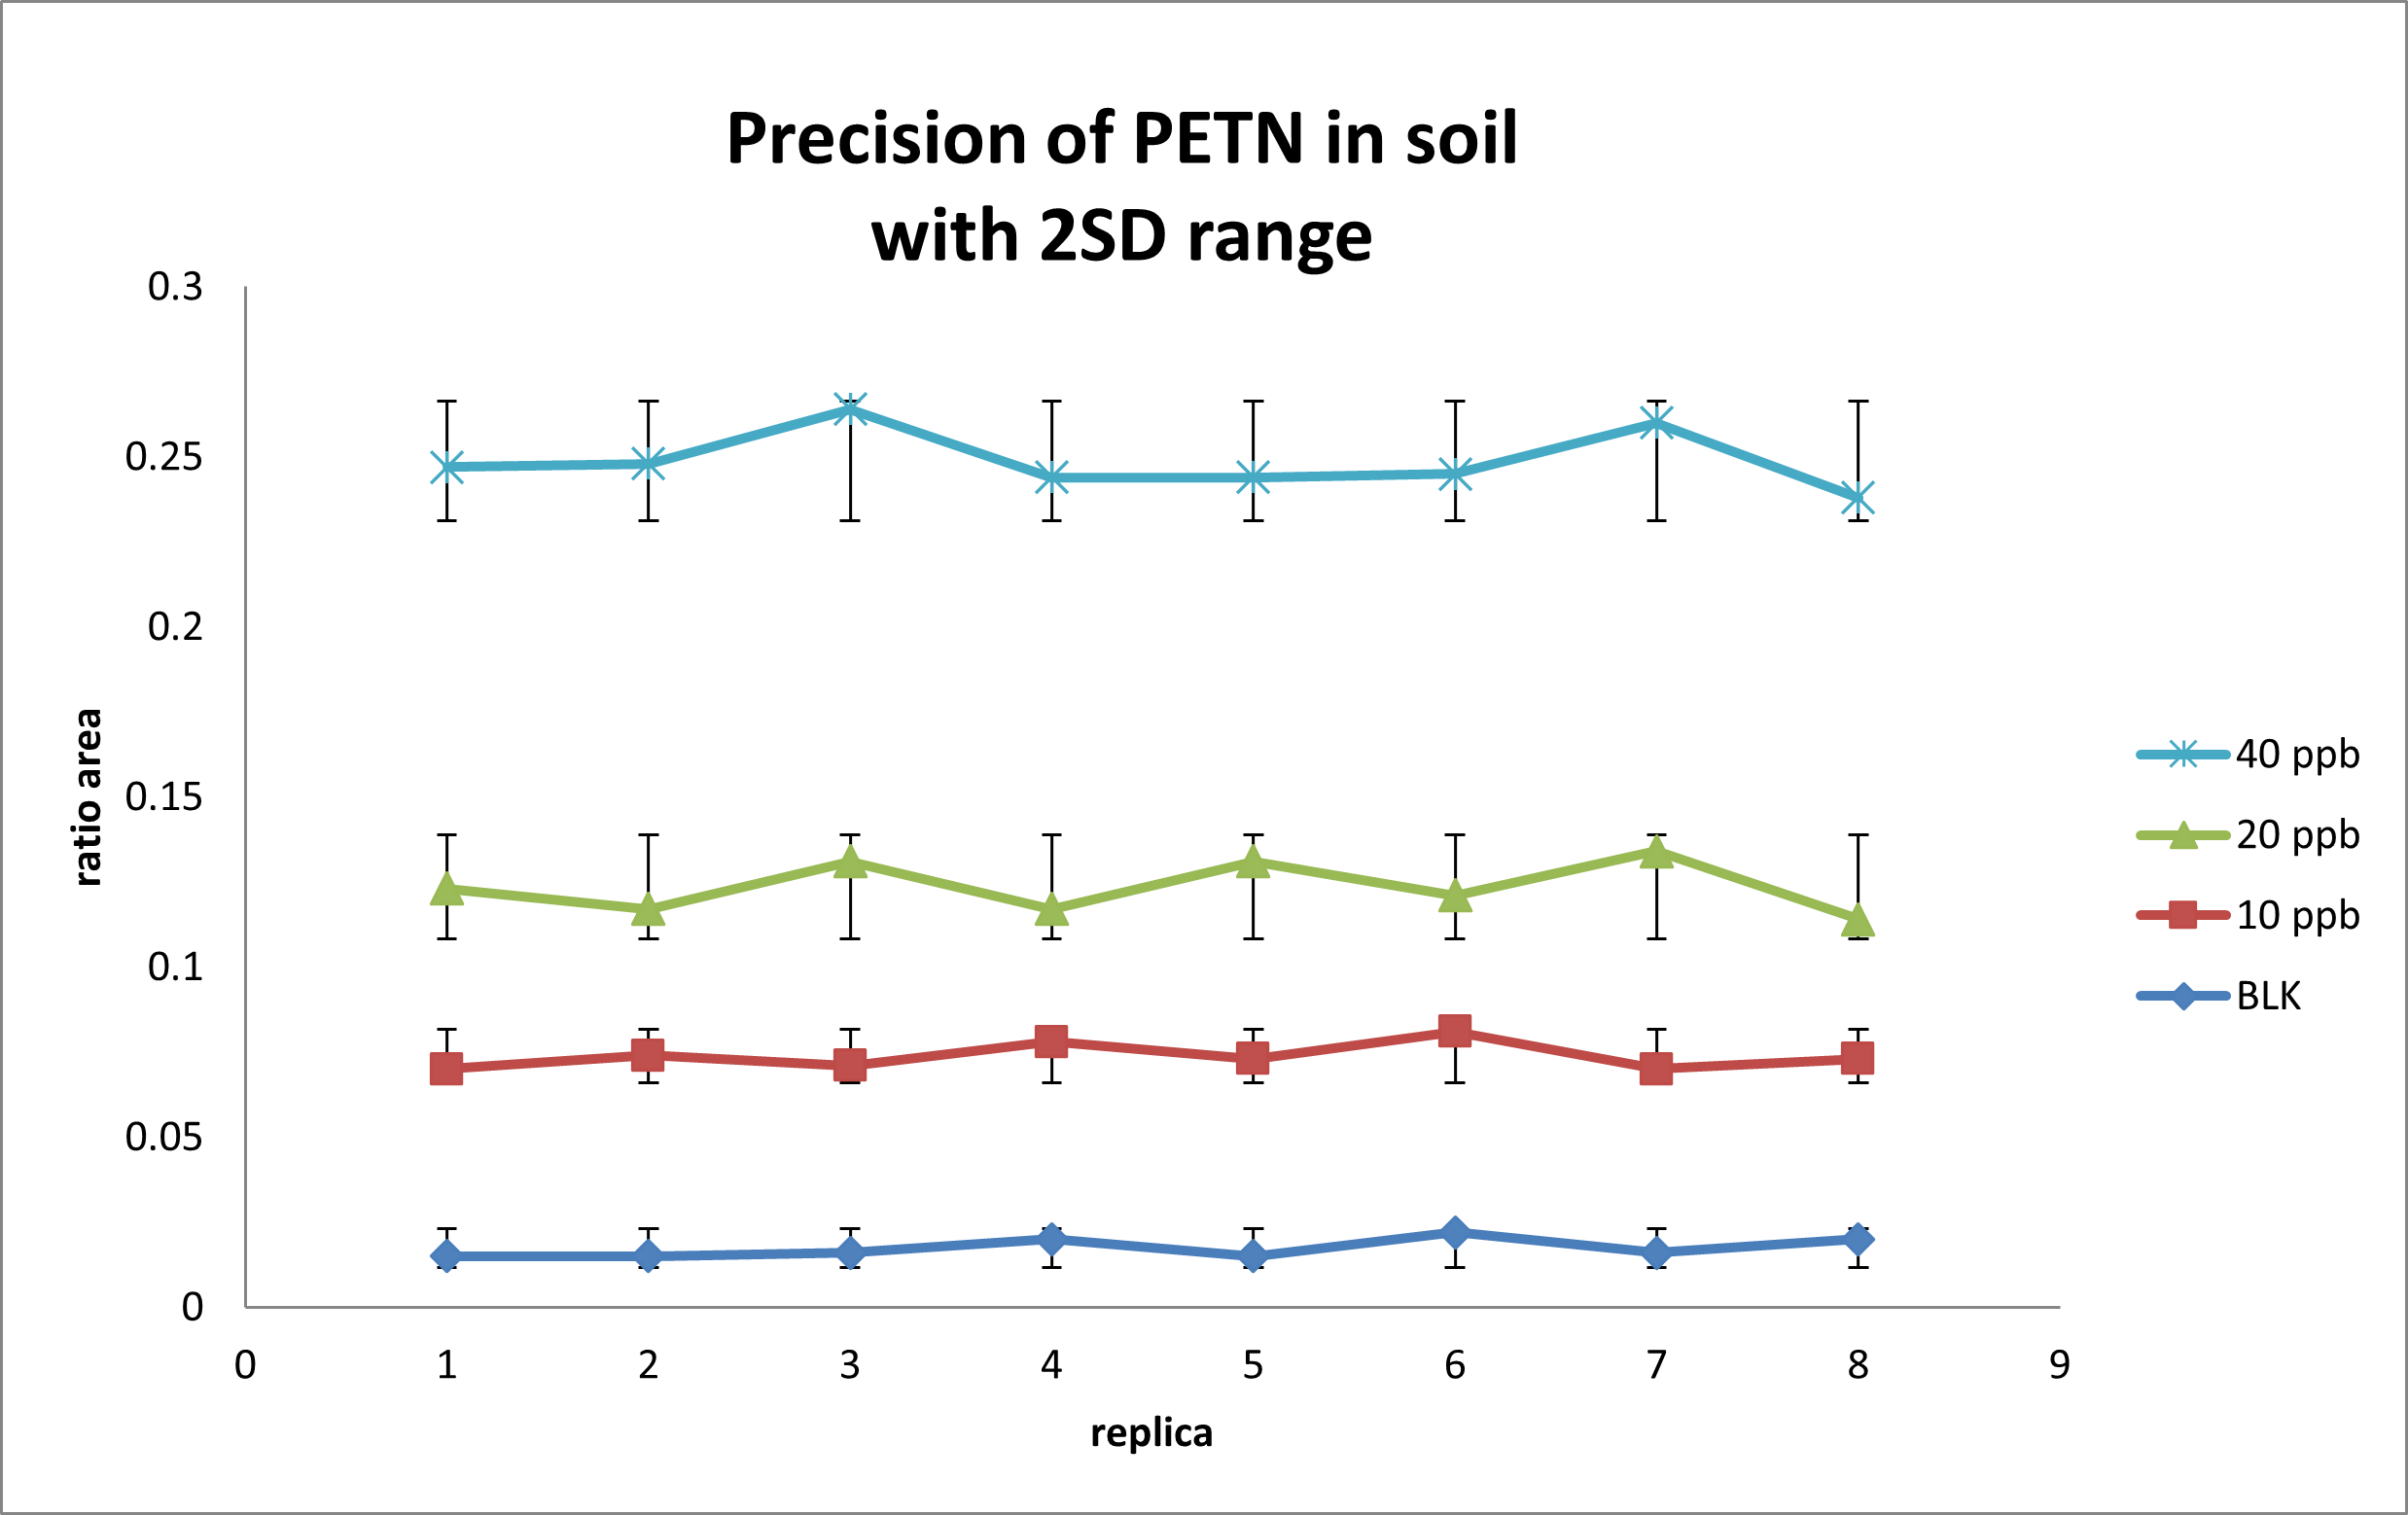
For the intra-run precision experiment, each fortified sample is extracted and analyzed in 8 replicates. Area ratio results are plotted using the ± 2 STD error bars. Figure 4 shows the intra-run results for PETN. No overlapping is observed for each concentration and the %CV was below 20%. Similar results are obtained for the other drugs in the panel.
Wet Stability of Sample Extracts
Following the extraction, sample extracts were kept at 4°C in closed containers. After 1 day, sample extracts were spotted on a LazWell™-DEC plate, dried and analyzed. Precision QCs samples are reported in Table 4. All the results were within the acceptable criteria range for 1 day at 4°C.
Dry Stability of Samples Spotted on LazWell™
Extracted samples are spotted onto a LazWell™ plate, dried and kept at room temperature for 1 hour before analysis. The precision and accuracy results of QCs are reported in Table 5. All the results are within the acceptable criteria range for 1 hour at room temperature.
| Parameters | Dry Stability (1 hour / RT) |
Wet Stability (1 day / 4°C) |
||||
|---|---|---|---|---|---|---|
| QC | QC-L | QC-M | QC-H | QC-L | QC-M | QC-H |
| Conc (ppb) | 10 | 20 | 40 | 10 | 20 | 40 |
| N | 3 | 3 | 3 | 3 | 3 | 3 |
| Mean (ppb) | 9.6 | 19.9 | 40.4 | 9.0 | 18.3 | 40.1 |
| %CV | 5.5 | 6.7 | 4.7 | 4.1 | 7.4 | 7.2 |
Field Map Evaluation
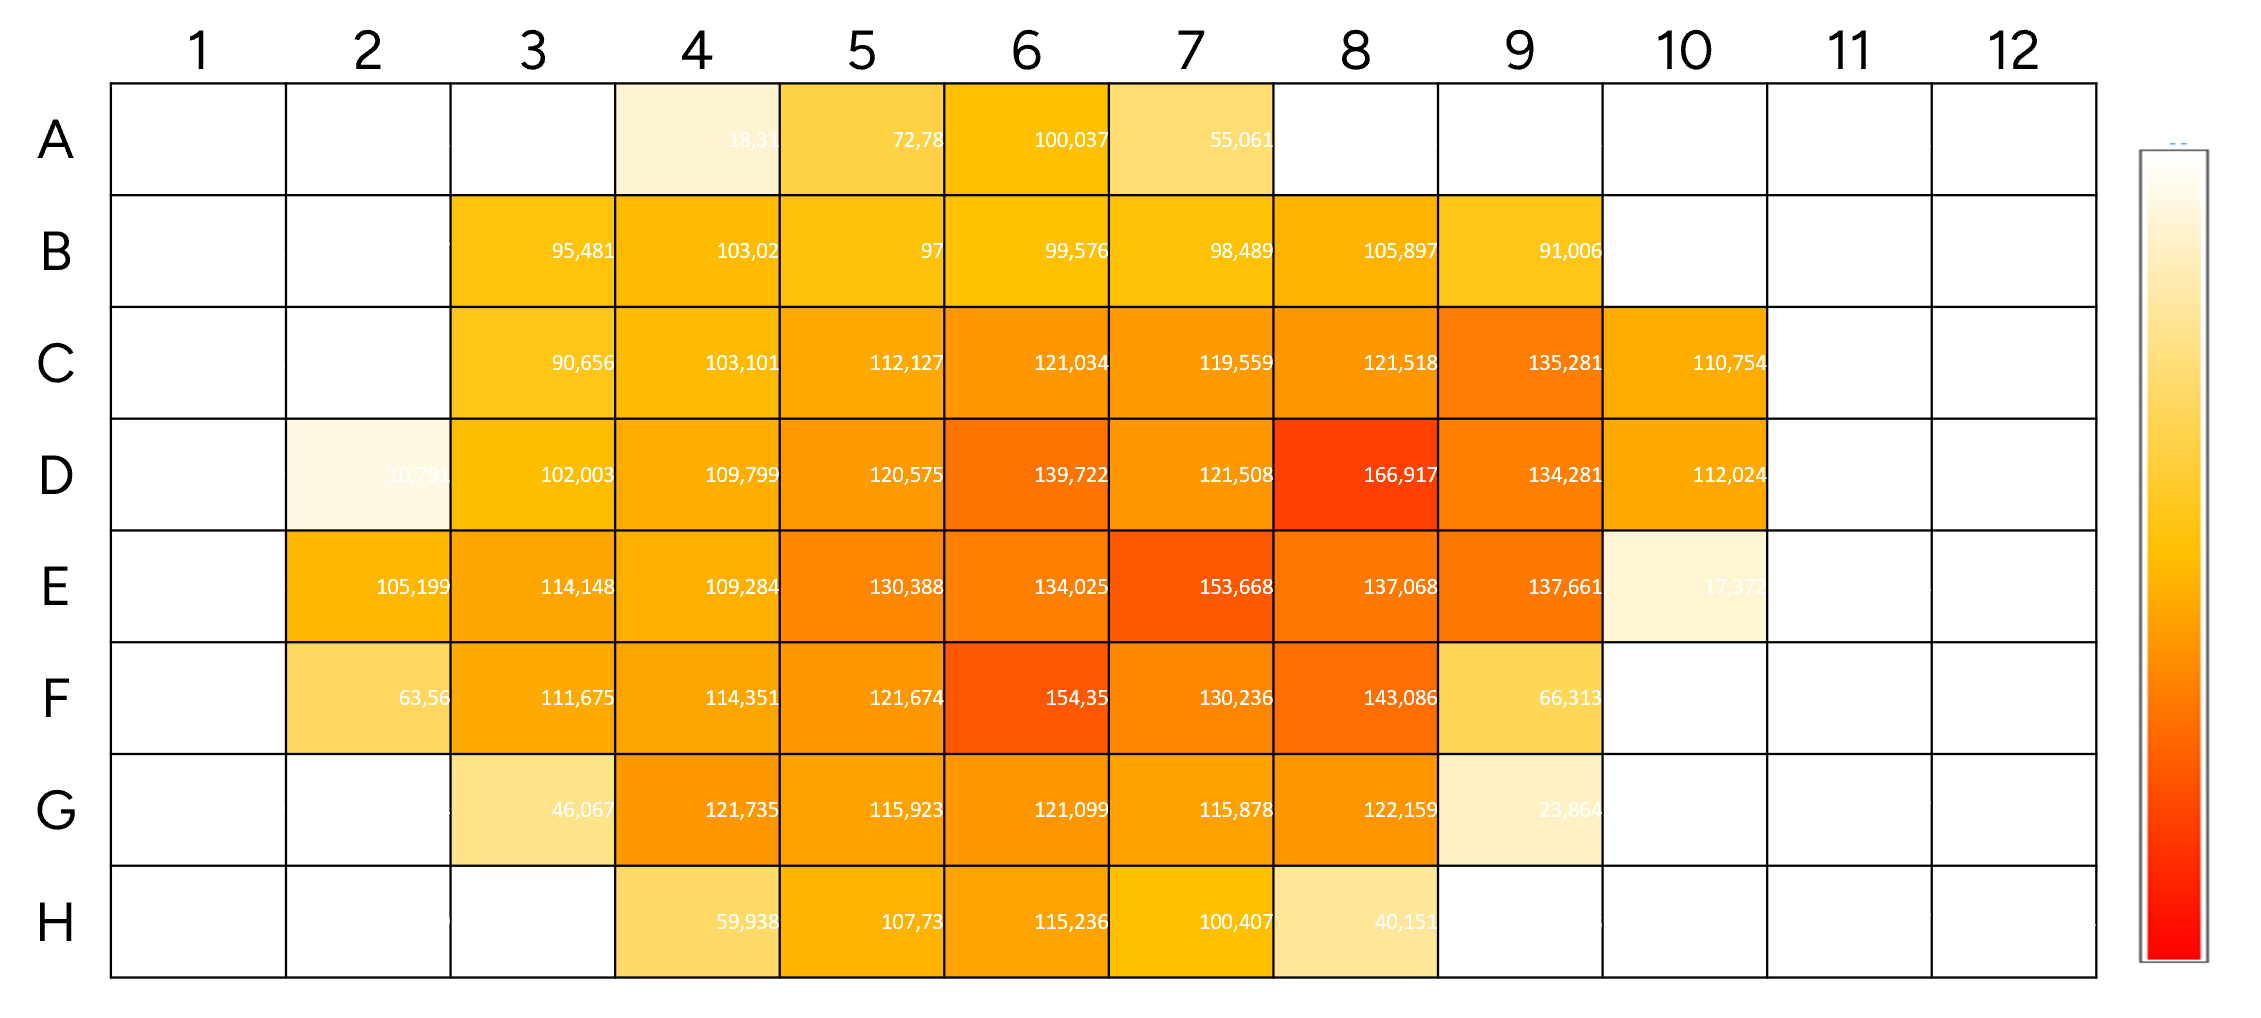
To simulate a field sampling, deep-well plates were filled with 96 X 1 g of negative soil. A HMX solution was added in the middle of the plate and dried overnight. All 96 samples were extracted and screened to evaluate the contaminated area (concentration higher than cut-off screen). Figure 5 shows the heat map results of HMX positive area (white means it is below the cut-off value. Yellow to red is a positive sample).
Conclusion
The Luxon Ion Source combined with Sciex QTrap 5500 mass spectrometer system allows the ultra-fast (8 seconds per sample) analysis of explosives in soil.