Introduction
Over the last decade, plant-based products laced with synthetic cannabinoids have increased. The analysis of the synthetic cannabinoid content in plant material is needed for health hazard assessments. Different structural classes (dibenzopyrans, cyclohexylphenols, naphthoylindoles, benzoylindoles, phenylacetylindoles, tetramethylcyclopropylindoles) are used as synthetic cannabinoids.
For this project, we propose to perform a serial addition of synthetic cannabinoids on plant material and define a screening extraction method using the LUXON coupled to a mass spectrometer (LUXON-MS/MS) as a fast-analytical technique.
LUXON ionization source
The Luxon Ion Source® (Figure 1) is the second-generation sample introduction and ionization source based on the LDTD® technology for mass spectrometry. Luxon Ion Source® uses Fiber-Coupled Laser Diode (Figure 2) to obtain unmatchable thermal uniformity providing more precision, accuracy and speed. The process begins with dry samples which are rapidly evaporated using indirect heat. The thermally desorbed neutral molecules are carried into a corona discharge region. High efficiency protonation and strong resistance to ionic suppression characterize this type of ionization and is the result of the absence of solvent and mobile phase. This thermal desorption process yields high-intensity molecular ion signal in less than 1 second sample-to-sample and allows working with very small volumes.
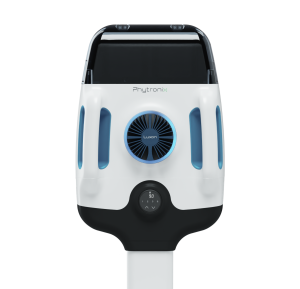
Figure 1 – Luxon Ion Source®
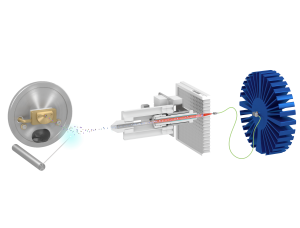
Figure 2 – Schematic of the Luxon Ionization Source
Sample Preparation Method
For the screening method, the following synthetic cannabinoids are used: JWH-018, AM-2201, 5-Fluoro PB-22, MAM-2201, XLR-11, AB-FUBINACA, APINACA and PB-22. 40 mg of plant material are weighed in a glass tube. 10 µL of a spiking solution (400, 200, 40, 20 and 4 µg/mL synthetic cannabinoids mixture) are added to get 100, 50, 10, 5 and 1 µg/g concentrations, respectively. The solvent is evaporated from the plant material before the extraction for the LDTD-MS/MS analysis.
Synthetic cannabinoids are sprayed on the surface of the leaf, so no attempt was made to homogenize the plant material content prior to sampling and analysis. Extraction is carried out as flows for spiked plant materials. 40 mL of ter-Butyl-Methyl ether containing internal standard (THC-d3 at 100 ng/mL) are added on spike sample. Tubes are capped, vortexed, then sonicated for 5 minutes. After centrifugation (5000 rpm, 2 minutes), 4 µL of the solution are spotted into LazWell™96 plates and evaporated to dryness. LDTD-MS/MS analysis is done after a complete evaporation.
LDTD-MS/MS Parameters
LDTD
Model: Phytronix, LUXON SH-960
Carrier gas: 3 L/min (air)
Laser pattern: 6-second ramp to 50% power
MS/MS
Model: Shimadzu LCMS-8060
Ionization: APCI
Positive MRM transition
| Cannabinoids | Transition | CE |
|---|---|---|
| THC- D 3 | 318 → 196 | 25 |
| XLR-11-OH* | 346 → 125 | 22 |
| JWH-018-OH* | 358 → 155 | 21 |
| PB-22 | 359 → 214 | 20 |
| AB-Fubinaca | 369 → 324 | 16 |
| AM2201-OH* | 376 → 155 | 24 |
| 5-Fluoro PB-22 | 377 → 144 | 38 |
| Apinaca-OH* | 382 → 135 | 24 |
| MAM2201-OH* | 390 → 169 | 25 |
Note: Hydroxy metabolites are used for the experiment. Restricted compounds are not available.
Results and Discussion
Linearity
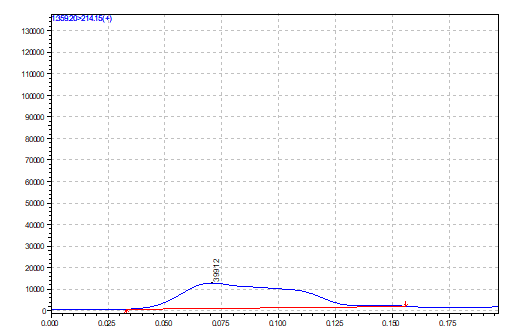
Synthetic cannabinoids spiked set at the following calibration range are extracted: 1 to 100 µg/g. Correlation coefficients are equal or greater than 0.99 for the quantification curve of all synthetic cannabinoids. Figure 3 shows the calibration curve of PB-22. Figure 4 shows the typical blank and PB-22 (1 µg/g) desorption peaks with a 0.16-minute window.
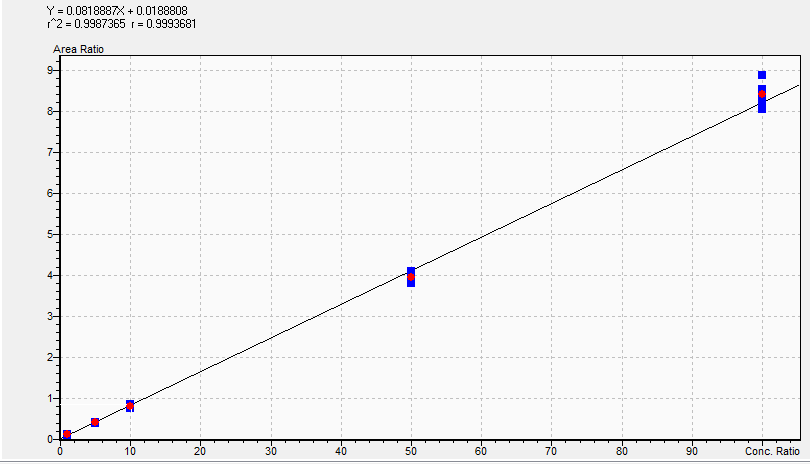
Figure 3 – PB-22 calibration curve
A) Blank
B) Standard : 1µg/g
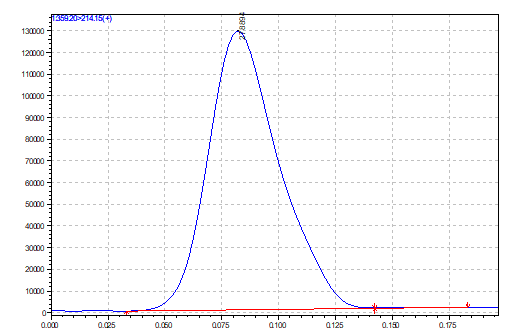
Figure 4 – Blank (A) and PB-22 (B) desorption peaks
Synthetic cannabinoids recovery
A spiked sample (10 µg/g) and blank are extracted. Blank extract is then spiked and used as a 100% recovery reference. The concentration of the reference and the spiked sample are evaluated against the calibration curve. A recovery between 86.0 and 108.3 % is obtained. Results are shown in Table 2.
| Synthetic cannabinoids | Recovery |
|---|---|
| PB-22 | 106.2 ± 0.2 |
| 5-Fluoro PB-22 | 108.3 ±0.2 |
| AB-FUBINACA | 104.5 ±0.4 |
| XLR-11-OH | 93.7 ±0.6 |
| JWH-018-OH | 86.0 ±0.5 |
| AM-2201-OH | 92.1 ±0.5 |
| APINACA-OH | 94.0 ±0.7 |
| MEM-2201-OH | 87.4 ±0.5 |
Precision around lower limit of detection (LOD)
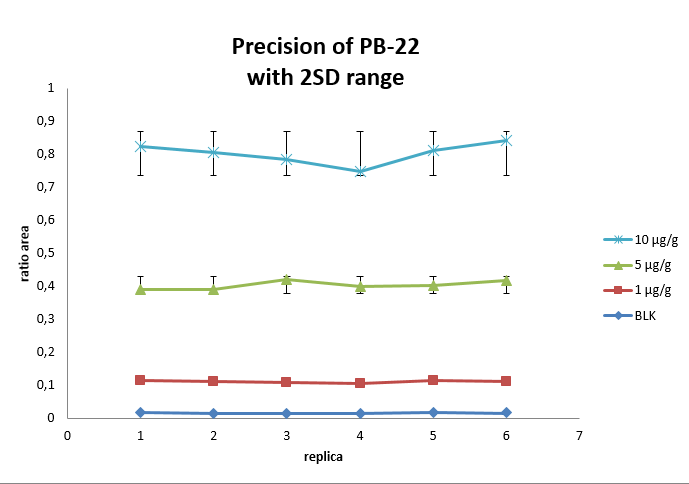
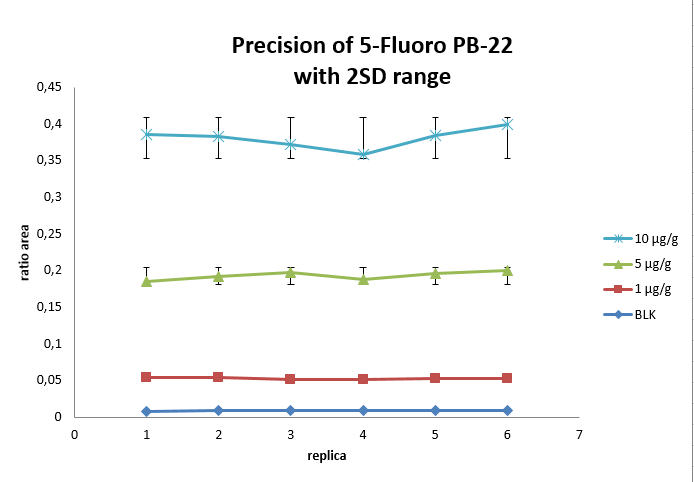
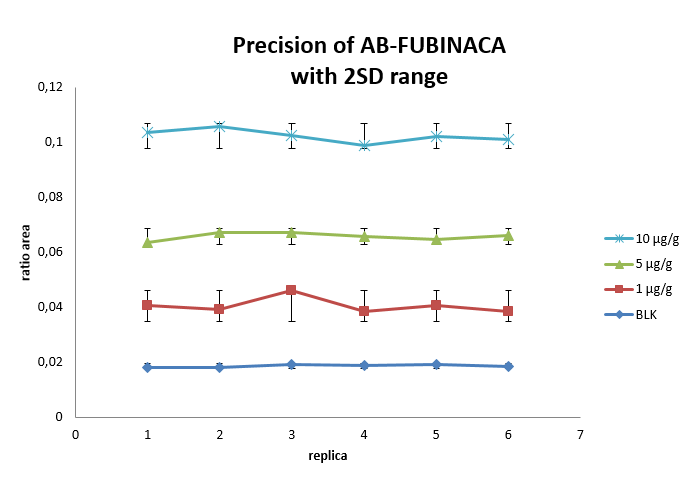
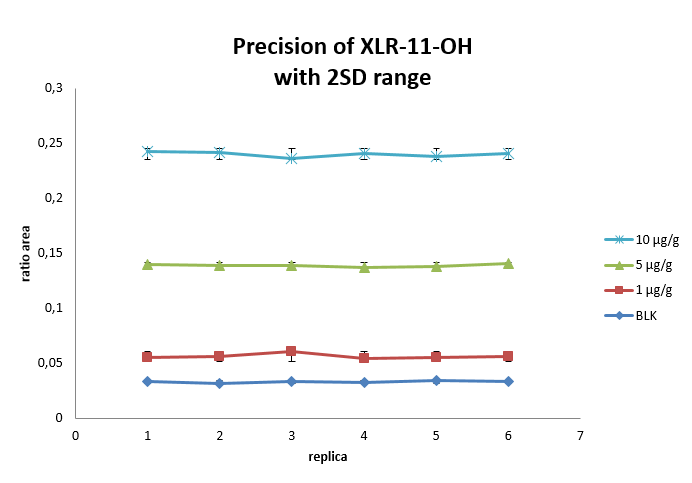
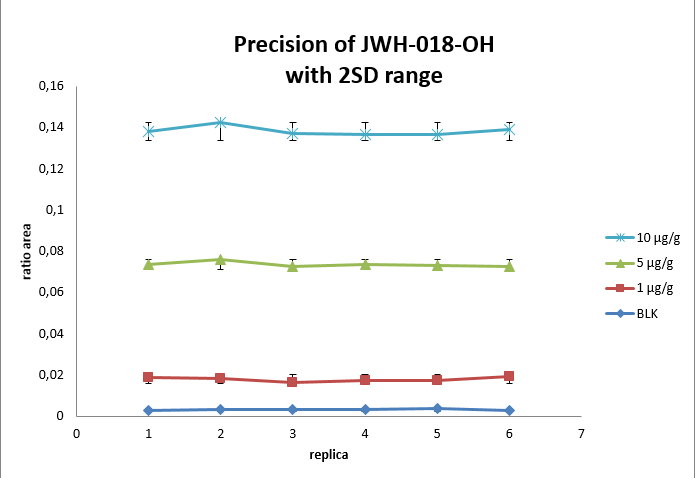
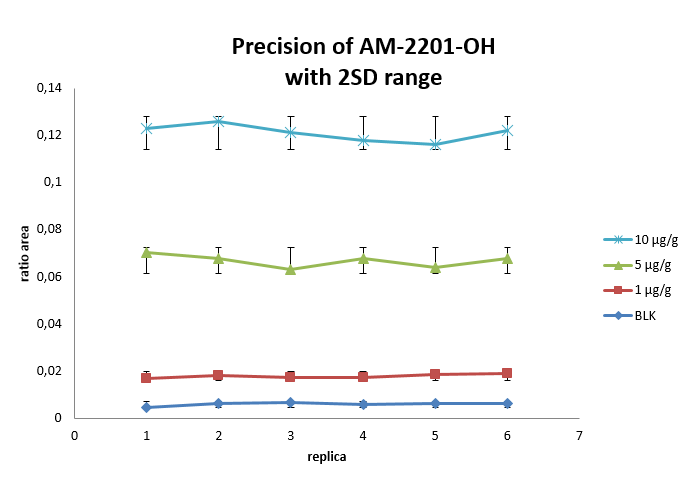
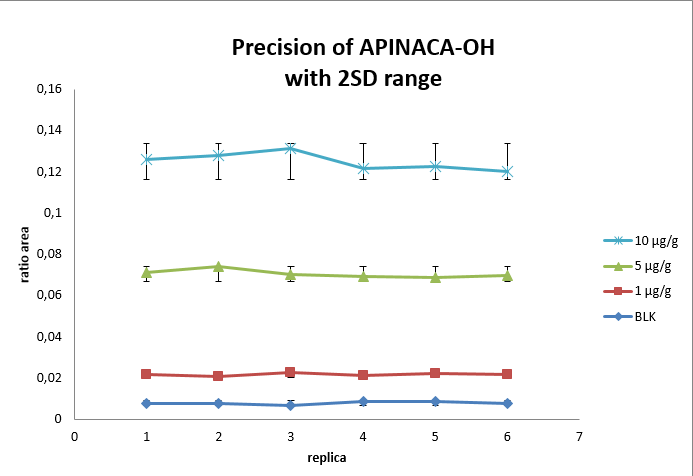
Spiked samples around the lower limit of detection (LOD) and blank solutions are used to validate the precision of the method. Each concentration must not exceed 20% CV and the mean concentration ± 2 times the standard deviation (± 2 SD) must not overlap with other concentrations at the decision point. The peak area against IS ratio was used to normalize the signal. Replicate extractions are deposited on a LazWell™ plate and dried before analysis. No overlapping at the LOD is observed for all curves and the CV% was below 15%. Results using the ± 2 SD overlay are plotted. Figure 5 shows the results.
(A)
(B)
(C)
(D)
(E)
(F)
(G)
(H)
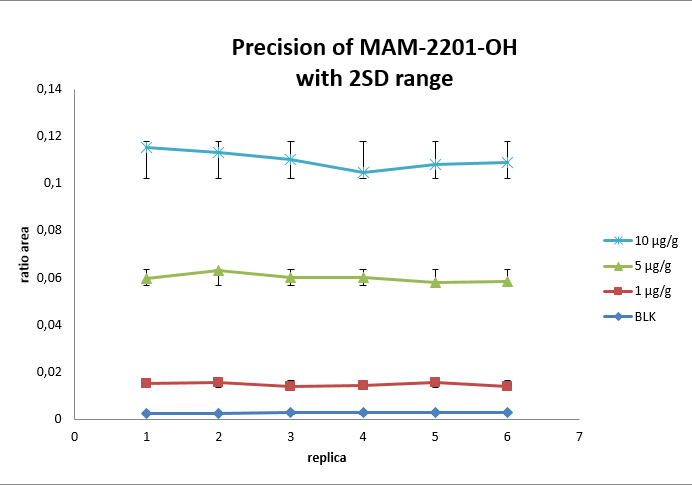
Figure 5 – 2 SD overlay plot
Conclusion
LUXON technology combined with an LCMS-8060 system allows ultra-fast (8 seconds per sample) and precise screening of synthetic cannabinoids on plant material using a simple plant dilution with internal standards.