Introduction
Yeasts mediums have a wide range of applications in the food industry, biomass production, biofuel industry and in the heterologous production of compounds. Literature data shows different applications for yeasts as a biocatalyst. To increase the analysis throughput of the optimization of biocatalysts and their follow-up, the Luxon Ion Source® coupled to tandem mass spectrometry (MS/MS) was used.
Our goal for this application note is to use an automated sample preparation method for the analysis of lovastatin in a yeast medium sample using a single operation in LDTD-MS/MS.
LDTD-MS/MS offers specificity combined with an ultra-fast analysis for an unrivaled analysis method. To develop this application, we focused on performing a quick and simple sample preparation. Lovastatin is analyzed and results are obtained in less than 1 second per sample.
Sample Preparation Method
Automated Sample Extraction
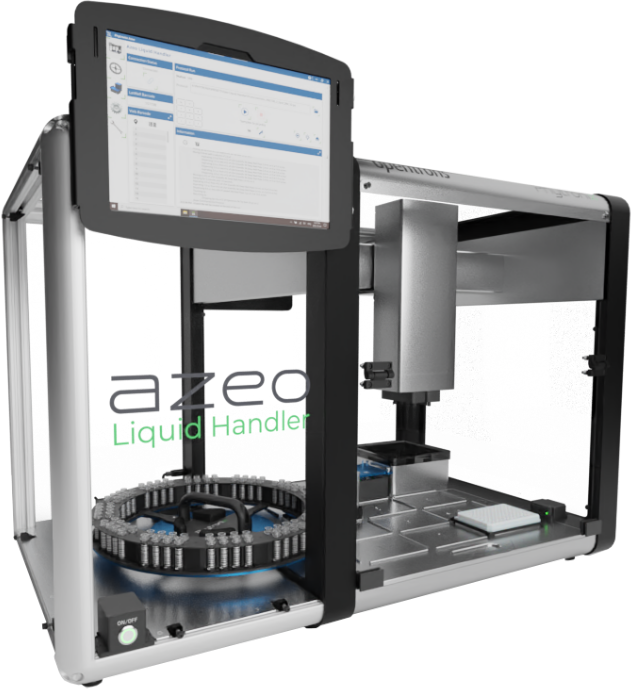
Yeast medium samples were transferred into barcoded tubes, readable by the Azeo Liquid Handler and transferred into the system. Each barcoded vial was scanned by the Azeo Liquid Handler (Figure 3).
Samples were extracted as followed:
- 100 µL of a Yeast sample were transferred into an extraction plate.
- 10 µL internal standard.
- Mix
- 100 µL NaCl (saturated in water).
- 200 µL Acetonitrile.
- Mix and centrifuge.
- 1 µL of the upper layer phase is spotted into 384-LazWell™ plate.
- Samples were evaporated to dryness at 40°C for 5 minutes.
- LDTD-MS/MS analysis is done after a complete evaporation.
LDTD®-MS/MS Parameters
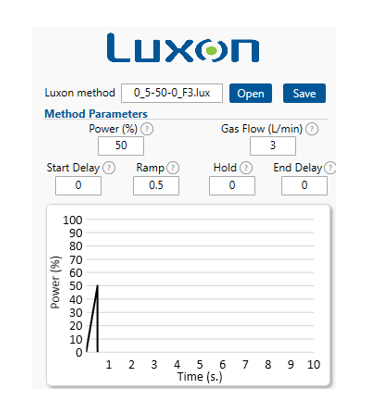
LDTD
Model: Luxon SH-3840, Phytronix
Carrier gas: 3 L/min (air)
Laser pattern: 0.5-second ramp to 50% power
MS/MS
MS model: LCMS-8060, Shimadzu
Ionization: APCI
Table 1 – Mass spectrometer transitions (Positive)
| Drugs | Transition | CE |
|---|---|---|
| Lovastatin | 405 → 199 | 20 |
| Simvastatin (IS) | 419 → 199 | 20 |
Results and Discussion
Data preparation process
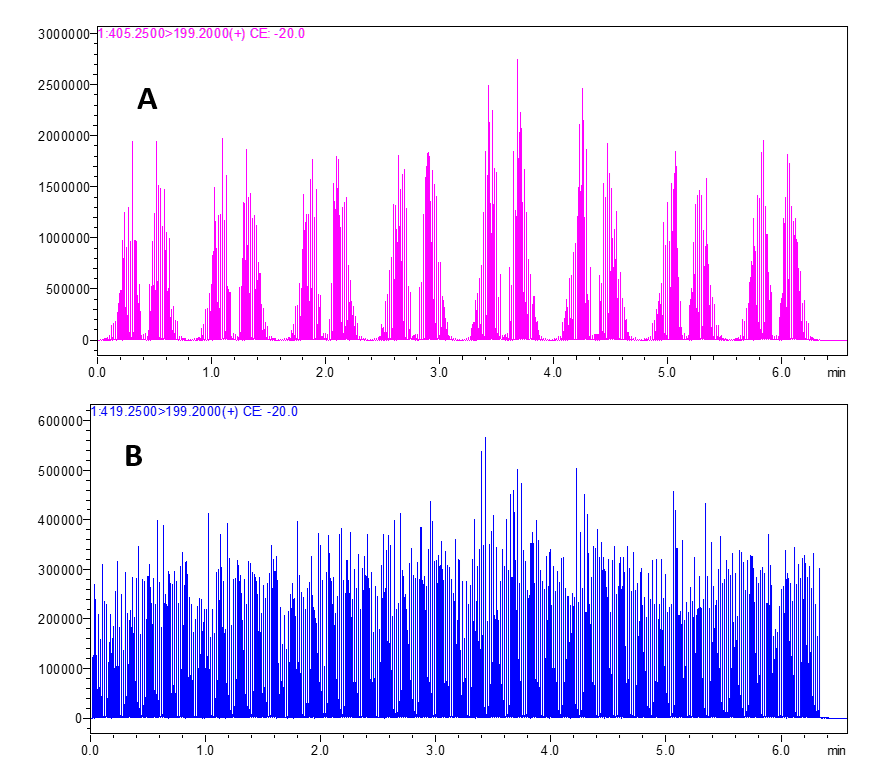
Mass spectrometers are data acquisition systems that were not designed to deal with < 1 second signal per sample. The synchronization sequence adds 6 to more than 15 seconds between each sample. To bypass this, all samples are acquired in a single file (Figure 5). To allow the analysis of such data, Cascade software is designed to detect, split and integrate every sample peak acquired in a single file.
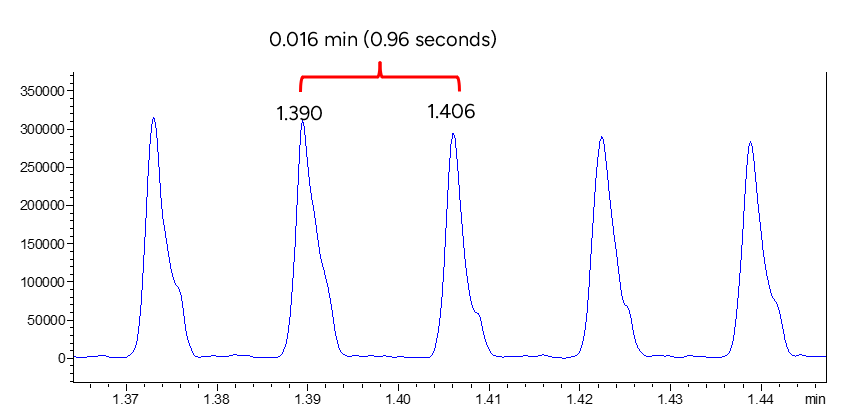
Desorption peak
Figure 6 shows a zoomed area of the transition of the internal standard in the single-file window. A speed of 0.96 seconds sample to sample was reached.
Validation Test
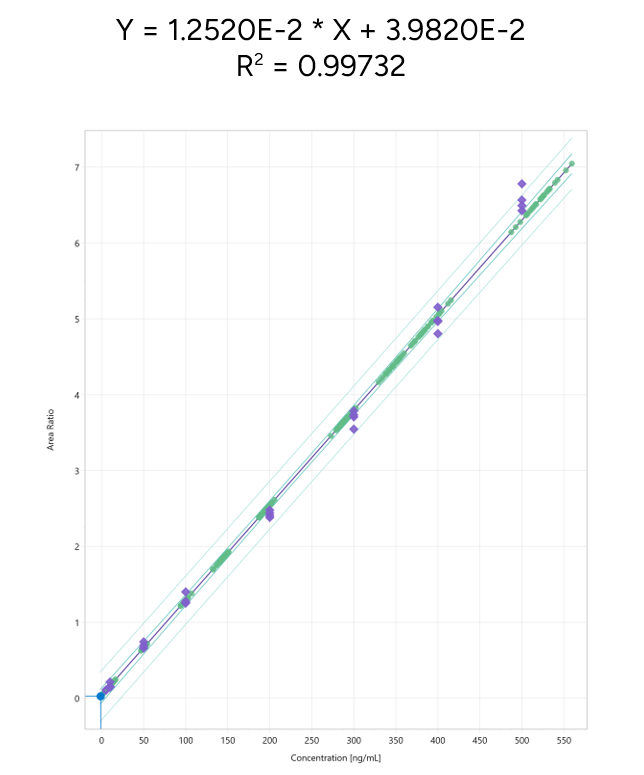
Calibration curves ranging from 5 to 500 ng/mL and QCs (Low, Medium and High) were prepared in a yeast medium1. Replicate extractions were deposited onto a LazWell™ plate and dried before analysis. The peak area against the internal standard (IS) ratio was used to normalize the signal.
Linearity
The calibration curves were plotted using the peak area ratio and the nominal concentration of standards. For the linearity test, the following acceptance criteria was used:
- Linear regression (r2) must be ≥ 99
Figure 7 shows a typical calibration curve result for Lovastatin.
Precision and Accuracy
For the accuracy and precision evaluation, the following acceptance criteria were used:
- Each concentration must not exceed 15% CV.
- Each concentration must be within 100 ± 15% of the nominal concentration.
For the intra-run precision and accuracy experiment, 32 replicate of each standard and QCs were analyzed. Table 2 shows the intra-run precision and accuracy results for Lovastatin. The obtained %CV was below 15% and the accuracy was within 15% of the nominal value.
Table 2 – Intra-Run Precision and Accuracy of Lovastatin
| Lovastatin | QC-L | QC-M | QC-H |
|---|---|---|---|
| Conc (ng/mL) | 15 | 150 | 350 |
| N | 32 | 32 | 32 |
| Mean (ng/mL) | 12.8 | 143.2 | 346.5 |
| SD | 1.4 | 4.5 | 8.3 |
| %CV | 11.3 | 3.1 | 2.4 |
| %Nom | 85.0 | 95.4 | 99.0 |
Conclusion
Luxon Ion Source® combined to a Shimadzu LC-8060 mass spectrometer system allows ultra-fast (0.96 seconds per sample) analysis of lovastatin in a yeast medium using a simple and automated sample preparation method.