Introduction
Phosphatidylcholines (PCs) are the major constituents of cell membranes. They are used as biomarkers for several diseases. This glycerophospholipid group contains a polar phosphocholine head connected to fatty acid sidechains via a glycerol backbone. Varying lengths and saturation of fatty acids may be observed. The fatty acids are connected via two types of chemical bounds on a glycerol backbone: ester (acryl: a) or ether (e). The following nomenclature will be used:
Ex: PCae C32:1
- PC: Phosphatidylcholine head
- ae: Fatty acid chemical bonds: acryl (a) or ether (e)
- C32: Sum of Carbons on both fatty acid chains
- 1: Number of double bonds.
Our goal for this application note is to present a generic method that allows the quantitation of various phosphatidylcholine (PCaa, PCae and LPCa) in plasma in less than 8 seconds per sample. The automated sample preparation is reduced to a minimum to keep up with the analysis throughput.
Luxon Ionization Source
The Luxon Ion Source® (Figure 1) is the second-generation sample introduction and ionization source based on the LDTD® technology for mass spectrometry. Luxon Ion Source® uses Fiber-Coupled Laser Diode (Figure 2) to obtain unmatchable thermal uniformity giving more precision, accuracy and speed. The process begins with dry samples which are rapidly evaporated using indirect heat. The thermally desorbed neutral molecules are carried into a corona discharge region. High-efficiency protonation and strong resistance to ionic suppression characterize this type of ionization and it is the result of the absence of solvent and mobile phase. This thermal desorption process yields high-intensity molecular ion signal in less than 1 second sample-to-sample and allows working with very small volumes.
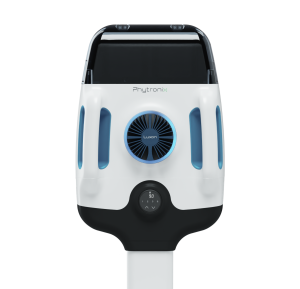
Figure 1 – Luxon Ion Source®
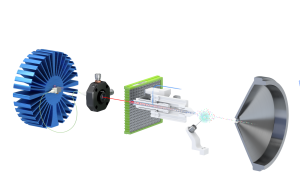
Figure 2 – Schematic of the Luxon Ionization Source
Sample Preparation Method (Automated)
An automated system (Figure 3) is used to extract the samples using the following conditions:
- 10 µL of plasma sample
- 10 µL of internal standard at 12 µM in IPA:ACN:Water (75:20:5)
- 150 µL of Methanol
- Vortex
- 500 µL of MTBE
- Vortex
- 150 µL of Water
- Vortex and phase separation by gravity
- Spot 5 µL of the upper-layer phase on a coated LazWell™96 plate
- Dry 2 minutes at room temperature with air flow
- Add 5 µL of the desorption solution
- Evaporate to dryness
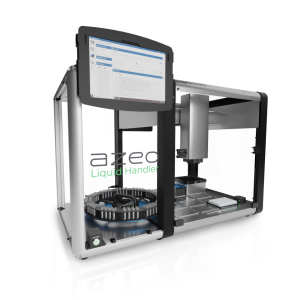
Figure 3 – Automated extraction system
Luxon-MS/MS Parameters
Luxon
Model: Luxon S-960, Phytronix
Carrier gas: 6 L/min (air)
Laser pattern:
- 3-second ramp to 100% power
- 3-second hold at 100% power
MS/MS
MS model: Q-Trap System® 5500, Sciex
Scan Time: 5 msec
CE: 30
Total run time: 8 seconds per sample
Ionization: APCI (positive)
Analysis Method: MRM mode
A common loss of 184 amu associated to the polar phosphocholine head is used to generate the MRM method. Some examples of the MRM transitions used can be found in Table 1.
| Phosphatidylcholine | Q1 | Q3 |
|---|---|---|
| PCaa C40:0 | 846.7 | 663.6 |
| PCaa C40:2 | 842.7 | 659.6 |
| PCaa C40:4 | 838.6 | 655.6 |
| PCaa C40:6 | 834.6 | 651.5 |
| PCae C40:0 | 832.7 | 649.6 |
| LPCa C20:0 | 552.4 | 369.3 |
Results and Discussion
Phospholipids analysis
This method evaluates the phospholipid profile based on the sum of carbon, hydrogen, and oxygen atoms on the fatty acid sidechain. Also, the peak area corresponds to the sum of the potential isobaric phosphatidylcholine according to the following rules:
| PC | Isobaric PC | Example | Empirical formula change |
|---|---|---|---|
| PCaa Cx:y | PCaa C20:0 | ||
| PCaa Cx+1:y+7 | PCaa C21:7 | + CH2, -14H | |
| PCae Cx+1:y | PCae C21:0 | + CH2, +2H, -O | |
| PCae Cx+2:y+7 | PCae C22:7 | +2 (CH2), -12H, -O | |
| LPCa Cx+1:y | LPCa C21:0 | + CH2, +2H, -O |
Precision
For the intra-run precision experiments, five different samples are analyzed in six replicates. Table 3, Table 4 and Table 5 show the intra-run results for PCaa C34:1, PCaa C34:2 and PCaa C36:2, respectively. No sample exceeds 15% CV. Similar results are obtained for the phospholipid transitions.
| PCaa C34:1 | M 1 | M 2 | M 3 | M 4 | M 5 |
|---|---|---|---|---|---|
| Calc. conc (µM) | 251.8 | 187.5 | 137.1 | 128.3 | 131.5 |
| N | 6 | 6 | 6 | 6 | 6 |
| %CV | 6.9 | 7.6 | 7.1 | 7.8 | 11.3 |
| PCaa C34:2 | M 1 | M 2 | M 3 | M 4 | M 5 |
|---|---|---|---|---|---|
| Calc. conc (µM) | 332.2 | 228.6 | 212.3 | 202.1 | 218.8 |
| N | 6 | 6 | 6 | 6 | 6 |
| %CV | 6.3 | 7.6 | 6.2 | 6.5 | 8.4 |
| PCaa C36:2 | M 1 | M 2 | M 3 | M 4 | M 5 |
|---|---|---|---|---|---|
| Calc. conc (µM) | 189.5 | 139.1 | 123.1 | 117.6 | 123.5 |
| N | 6 | 6 | 6 | 6 | 6 |
| %CV | 7.1 | 5.1 | 10.6 | 7.0 | 7.6 |
To determine the inter-run precision, five different samples are analyzed in three runs. Table 6, Table 7 and Table 8 show the inter-run results for PCaa C34:1, PCaa C34:2 and PCaa C36:2, respectively. No sample exceeds 15% CV. Similar results are obtained for the phospholipid transitions.
| PCaa C34:1 | M 1 | M 2 | M 3 | M 4 | M 5 |
|---|---|---|---|---|---|
| Calc. conc (µM) | 239.4 | 179.9 | 137.4 | 128.1 | 132.6 |
| N | 18 | 18 | 18 | 18 | 18 |
| %CV | 13.4 | 13.5 | 11.6 | 10.6 | 8.1 |
| PCaa C34:2 | M 1 | M 2 | M 3 | M 4 | M 5 |
|---|---|---|---|---|---|
| Calc. conc (µM) | 313.8 | 218.5 | 215.2 | 199.8 | 209.3 |
| N | 18 | 18 | 18 | 18 | 18 |
| %CV | 13.2 | 13.7 | 11.2 | 9.5 | 9.1 |
| PCaa C36:2 | M 1 | M 2 | M 3 | M 4 | M 5 |
|---|---|---|---|---|---|
| Calc. conc (µM) | 176.0 | 129.8 | 121.6 | 113.7 | 123.5 |
| N | 18 | 18 | 18 | 18 | 18 |
| %CV | 12.2 | 14.1 | 13.8 | 9.5 | 7.6 |
Method Comparison Evaluation
Plasma samples from healthy patients (N=24) have been tested with this method to correlate with results obtained with the assay reference kit AbsoluteIDQ™ (N=220). The median concentration values were determined for 37 different phosphatidylcholines and used for the statistical evaluation. Table 9 shows the phosphatidylcholines used for the method comparison.
| PCaa C30:0 | PCaa C34:2 | PCaa C36:0 | PCaa C37:3 | PCaa C38:5 | PCaa C40:6 |
| PCaa C32:0 | PCaa C34:3 | PCaa C36:1 | PCaa C37:4 | PCaa C39:1 | PCaa C42:6 |
| PCaa C32:1 | PCaa C34:4 | PCaa C36:2 | PCaa C37:5 | PCaa C39:5 | |
| PCaa C32:2 | PCaa C35:1 | PCaa C36:3 | PCaa C37:6 | PCaa C39:6 | |
| PCaa C33:1 | PCaa C35:2 | PCaa C36:4 | PCaa C38:0 | PCaa C40:3 | |
| PCaa C33:2 | PCaa C35:3 | PCaa C36:5 | PCaa C38:3 | PCaa C40:4 | |
| PCaa C34:1 | PCaa C35:4 | PCaa C36:6 | PCaa C38:4 | PCaa C40:5 |
The Passing-Bablok regression (Figure 4) reveals a correlation and no significant deviation from linearity. The Bland and Altman plot (Figure 5) shows the mean value bias of the two methods. All samples are within the confidence interval of 95%.
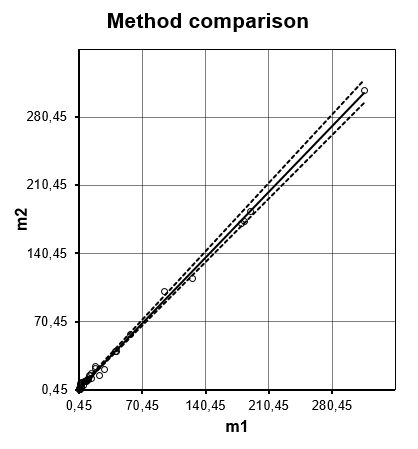
Figure 4 – Passing-Bablok regression curve
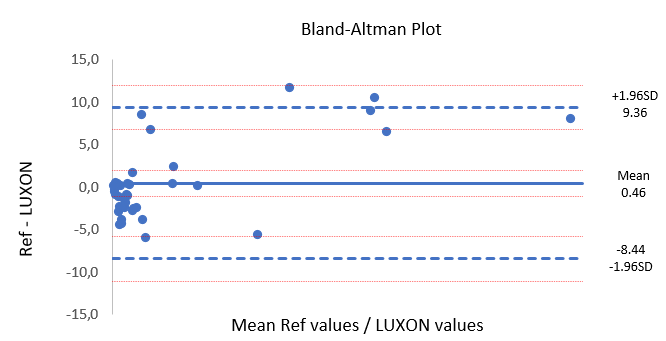
Figure 5 – Bland and Altman plot
Conclusion
A system combining Luxon Ion Source® with a Sciex 5500 Q-Trap mass spectrometer allows the ultra-fast (8 seconds per sample) phosphatidylcholine profiling in plasma samples using a simple and automated sample preparation method.