Introduction
Oral fluid drug testing is an increasingly popular method for detecting substance abuse, due to the ease and speed of sample collection. However, if the sample is not taken directly by an official, it is not possible to know the integrity of the sampling and/or the sample.
The objective of this application is to develop a rapid quantification method to analyze cholesterol in oral fluid using LDTD-MS/MS to assess sample integrity and detect samples that have never been in contact with oral fluid.
The LDTD-MS/MS system offers specificity combined with ultra-rapid analysis for the analysis of cholesterol in oral fluid samples. To develop this application, we focused on making sample preparation simple and fast. LDTD-MS/MS analysis is performed in less than 8 seconds per sample.
Luxon Ionization Source
The Luxon Ion Source® (Figure 1) is the second-generation sample introduction and ionization source based on the LDTD® technology for mass spectrometry. Luxon Ion Source® uses Fiber-Coupled Laser Diode (Figure 2) to obtain unmatchable thermal uniformity giving more precision, accuracy and speed. The process begins with dry samples which are rapidly evaporated using indirect heat. The thermally desorbed neutral molecules are carried into a corona discharge region. High efficiency protonation and strong resistance to ionic suppression characterize this type of ionization and is the result of the absence of solvent and mobile phase. This thermal desorption process yields high intensity molecular ion signal in less than 1 second sample to sample and allows working with very small volumes.
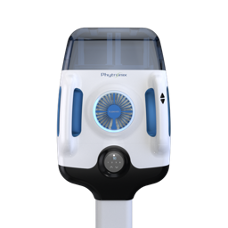
Figure 1 – Luxon Ion Source®

Figure 2 – Schematic of the Luxon Ionization Source
Sample Preparation Method
Sample Collection
Oral fluids were collected using the Quantisal® device. After the collection of the oral fluid, the pad is transferred into a tube containing an extraction buffer. During this process, oral fluids are diluted by a factor of 4. To quantify cholesterol, oral fluid is replaced by water in the calibration curve.
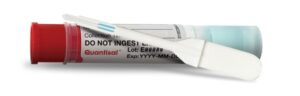
Figure 3 – Quantisal device for oral fluid sample collection (1)
Sample Extraction
- In a borosilicate tube (12X75 mm), 10 µL of Internal standard in methanol is added
- 100 µL of OF sample mixed with Quantisal buffer (1/3) are added
- 25 µL of methanol are added (for calibration curve and QCs, working solution 1X in methanol are added)
- Vortex 30 seconds
- 500 µL of extraction solution are added (DCM/Cl3CH/Isopropanol/Heptane (80/25/8.5/16.5)
- Vortex (1000 rpm/90 seconds)
- Centrifuge (5000 rpm/5 min)
- In a second borosilicate tube (12X75 mm) mix 300 µL of the bottom layer with 75 µL of the evaporation solution (1% acetic acid in methanol).
- Evaporate until dryness with gentle airflow at room temperature (RT)
- Add 40 µL of acetonitrile to reconstitute samples.
- Vortex 30 seconds
- Add 40 µL of desorption solution
- Vortex 30 seconds
- Spot 4 µL of mixture on a LazWell™96 plate
- Dry 8 minutes at RT
LDTD®-MS/MS Parameters
LDTD
Model: Luxon S-960, Phytronix
Carrier gas: 6 L/min (air)
Laser pattern:
- 1-second start delay
- 6-second ramp to 65% power
MS/MS
MS model: QTRAP 5500, Sciex
Scan Time: 50 msec
Ionization: APCI
Analysis Method: Positive ionization mode
Table 1 – MRM transitions for LDTD-MS/MS
| Compound | Transition | CE | DP |
| Cholesterol | 369.0161.0 | 30 | 80 |
| Cholesterol-d7 | 376.0161.0 | 30 | 80 |
Results and Discussion
Initial Cut-off Test (ng/mL)
Linearity
Samples were spiked at 0.5 µg/mL to 5 µg/mL. Standard working solutions were prepared in methanol. Calibration points were extracted in triplicate to obtain a coefficient of variation higher than 0.99.
Table 2 – Coefficient of correlation obtain for 6 runs.
| Run | Equation (Y = a x + b) | Coefficient of correlation (r) |
| 1 | Y = 6.3455 x + 3.8559 | 0.9955 |
| 2 | Y = 4.0600 x + 3.1070 | 0.9955 |
| 3 | Y = 5.6730 x + 2.6677 | 0.9927 |
| 4 | Y = 4.7293 x + 2.9432 | 0.9928 |
| 5 | Y = 4.8288 x + 3.7645 | 0.9967 |
| 6 | Y = 5.4924 x + 2.9068 | 0.9962 |
Precision and Accuracy
Each calibration point was used to validate the precision and the accuracy of the method. The peak area against the internal standard (IS) ratio was used to normalize the signal. Replicate extractions are deposited on a LazWell™ plate and dried before analysis.
The following acceptance criteria were used:
- Each standard must not exceed 15%CV for at least 66.6% of samples.
- Each standard must not exceed 15% Bias for at least 66.6% of samples.
For intra-run precision and accuracy experiment, a fortified sample set in water was extracted and analyzed in triplicate. Table 3 shows intra-run results, %CV and % Bias obtained were lower that 15 % for each concentration analyzed. For the inter-run precision experiment, each fortified sample set is analyzed in triplicate on four different days. Table 4 shows the inter-run precision and accuracy results. %CV and %Bias were below 15%.
Table 3 – Intra-Run Precision and Accuracy Results
| Cholesterol | S1 | S2 | S3 | S4 |
| Conc (µg/mL) | 0.5 | 1 | 2 | 5 |
| N | 3 | 3 | 3 | 3 |
| Mean (µg/mL) | 0.5 | 1.0 | 2.1 | 4.9 |
| %CV | 8.9 | 8.8 | 2.7 | 4.1 |
| %Bias | -3.8 | -1.0 | 13.3 | 10.0 |
Table 4 – Inter-Run Precision and Accuracy Results
| Cholesterol | S1 | S2 | S3 | S4 |
| Conc (µg/mL) | 0.5 | 1 | 2 | 5 |
| N | 17 | 16 | 17 | 16 |
| Mean (µg/mL) | 0.5 | 1.0 | 2.1 | 5.0 |
| %CV | 10.2 | 10.0 | 6.0 | 4.8 |
| %Bias | 1.8 | 0.6 | 5.9 | 3.8 |
Wet Stability of Sample Extracts
Following the extraction, the extracted sample was mixed with a desorption solution and kept at 4°C in closed containers. After 1 day, extracted samples are spotted on a LazWell™ plate, dried and analyzed. Sample precision and accuracy are reported in Figure 4. All the results are within the acceptable criteria range for 2 days at 4°C.
Dry Stability of Samples in LazWell™
Extracted samples are spotted onto a LazWell™ plate, dried and kept at room temperature for 1 hour and 2 hours before analysis. The precision and accuracy results are reported in Figure 4. All the results are within the acceptable criteria range for 2 hours at room temperature.
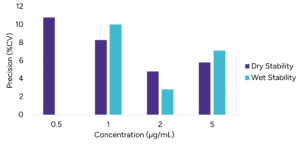
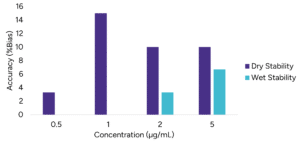
Figure 4 – Wet and Dry stability evaluation: A) Precision results B) Accuracy results
Multi-Matrix validation
Five different oral fluid matrices were analyzed by LDTD-MS/MS and by LC-MS/MS. Samples were collected using Quantisal device than extracted using the method previously mentioned. Multi-matrix validation results are shown in Table 5. The difference (in %) between the two instrumental methods were lower than 20 % for all five matrices.
Table 5 – Multi-matrix validation for cholesterol (n=1)
| LUXON-MS/MS | LC-MS/MS | % Difference | |
| Matrix 1 | 2.0 | 1.7 | 16.9 |
| Matrix 2 | 1.8 | 1.7 | 6.7 |
| Matrix 3 | 1.1 | 0.9 | 18.2 |
| Matrix 4 | 1.0 | 0.9 | 5.7 |
| Matrix 5 | 1.2 | 1.0 | 17.9 |
Integrity evaluation
To identify false oral fluid samples that can be submitted by patients, two false samples were introduced into the matrices lot and all samples were extracted. One sample was dipped in water before closing the Quantisal collection device (absorbed water instead of oral fluid) and one sample did not absorb any water or oral fluid and was placed directly into the Quantisal collection device. The cholesterol concentration must be higher than 0.5 µg/mL to be considered a real sample. Results are presented in Table 6.
Table 6 – Integrity evaluation of Oral fluid sample
| Unknown sample | Cholesterol concentration (µg/mL) | Pass or fail | Identification of samples |
| Sample 1 | 0.0 | Fail | Water |
| Sample 2 | 1.3 | Pass | Matrix 1 |
| Sample 3 | 1.1 | Pass | Matrix 2 |
| Sample 4 | 0.1 | Fail | Empty |
| Sample 5 | 0.6 | Pass | Matrix 3 |
| Sample 6 | 0.8 | Pass | Matrix 4 |
| Sample 7 | 0.8 | Pass | Matrix 5 |
Conclusion
Luxon Ion Source® combined to a Sciex QTRAP 5500 mass spectrometer system allows ultra-fast (8 seconds per sample) for evaluating the integrity of Oral fluid samples using a simple sample preparation method.
Reference
- Quest Diagnostics, Drug monitoring oral fluid collection [Online], URL: https://www.questdiagnostics.com/healthcare-professionals/about-our-tests/drug-testing/oral-fluid-collection (accessed on 2024-05-23).