Introduction
Vitamin K1 (Phylloquinone) is an important compound that plays a key role in the synthesis of several blood coagulation factors, in bone metabolism and in vascular calcifications.
Our goal for this application note is to use a combination of efficient sample preparation and ion mobility technique for the quantification of vitamin K1 in serum using the Luxon Ion Source®, based on the LDTD® technology.
LDTD-MS/MS offers specificity combined with an ultra-fast analysis for an unrivaled quantification method. To develop this application, we focused on performing an efficient sample preparation. Vitamin K1 is analyzed, and results are obtained in less than 12 seconds per sample.
Sample Preparation Method
Due to the instability of vitamin K1, stock solutions were prepared in ethanol (0.01% BHT). Pooled serum was exposed to UV light for at least 24h due to photodegradation of endogenous vitamin K. The pooled exposed serum was then spiked to generate a calibration curve and QC.
- 200 µL of serum sample were transferred to a tube.
- 10 µL of Internal standard (Phylloquinone-D7, 100 ng/mL in EtOH (0.01% BHT) were added to each sample.
- Mix
- 200 µL of EtOH (0.01%BHT) were added.
- Mix
- 1000 µL of Hexane were added.
- Mix
- Centrifuge 3 minutes/5000 rpm
- 600 µL of upper layer phase were transferred into a new tube and evaporated to dryness.
- Tubes were reconstituted with 1000 µL of Hexane.
- SPE (Silica: 100 mg/1cc)
- Activation:
- 1 mL Hexane: Diethyl ether (1:1)
- 3 X 1 mL Hexane
- Load:
- 1 mL reconstituted sample
- Wash:
- 3 X 1 mL Hexane
- Elution:
- 1 mL Hexane: Diethyl ether (97:3)
- Spot 6 µL of the elution phase onto a LazWell™ 96 plate
- Dry 3 minutes at room temperature
LDTD®-MS/MS Parameters
LDTD
Model: Luxon S-960, Phytronix
Carrier gas: 7.5 L/min (air)
Laser pattern: 9-second ramp to 75% power
Ion Mobility
SelexION QTrap® System 5500, Sciex
DMS Temperature (DT): Low
Modifier: None
Separation Voltage (SV): 4200
Compensation Voltage (COV): 18
DMS offset (DMO): -3
MS/MS
MS model: QTrap® System 5500, Sciex
IonSpray Voltage: 4800
Temperature, GS1 and GS2 set to zero.
CUR: 30
CAD: 8
Scan Time: 100 msec
Analysis Method: Positive MRM mode
| Transition | CE (V) | |
|---|---|---|
| Vitamin K1 | 451.2 → 187.1 | 35 |
| Phylloquinone-d7 | 458.3 → 194.1 | 35 |
Results and Discussion
Validation Test
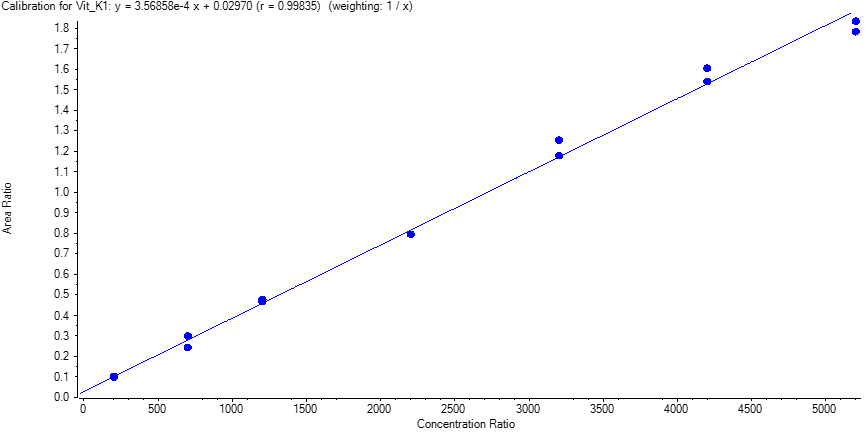
Calibration curves ranging from 200 to 5200 pg/mL were prepared in a photodegraded serum. Replicate extractions were deposited onto a LazWell™ plate and dried before analysis. The peak area against the internal standard (IS) ratio was used to normalize the signal.
Linearity
The calibration curves were plotted using the peak area ratio and the nominal concentration of standards. For the linearity test, the following acceptance criteria was used:
- Linear regression (r) must be ≥ 0.995
Table 2 shows the inter-day correlation coefficients for Vitamin K1. Values greater than 0.995 are obtained. Figure 3 shows a typical calibration curve result for Vitamin K1.
| Vitamin K1 | |
|---|---|
| Curve 1 | 0.99811 |
| Curve 2 | 0.99718 |
| Curve 3 | 0.99714 |
| Curve 4 | 0.99796 |
| Curve 5 | 0.99835 |
Precision and Accuracy
For the accuracy and precision evaluation, the following acceptance criteria were used:
- Each concentration must not exceed 15% CV.
- Each concentration must be within 100 ± 15% of the nominal concentration.
For the intra and inter-run precision and accuracy experiment, each QC was analyzed in sextuplicate, on five different days. Table 3 and 4 show the intra and inter-run precision and accuracy results for Vitamin K1. The obtained %CV was below 15% and the accuracy was within 15% of the nominal value.
| Vitamin K1 | QC-L | QC-M | QC-H |
|---|---|---|---|
| Conc (pg/mL) | 700 | 2200 | 4200 |
| N | 6 | 6 | 6 |
| Mean (pg/mL) | 679.9 | 2186.1 | 4228.5 |
| %CV | 10.9 | 5.5 | 3.9 |
| %Nom | 97.1 | 99.4 | 100.7 |
| Vitamin K1 | QC-L | QC-M | QC-H |
|---|---|---|---|
| Conc (ng/mL) | 700 | 2200 | 4200 |
| N | 30 | 30 | 30 |
| Mean (ng/mL) | 674.7 | 2156.7 | 4280.8 |
| %CV | 12.5 | 5.2 | 4.3 |
| %Nom | 96.4 | 98.0 | 101.9 |
Wet Stability of Sample Extracts
Following the extraction, sample extracts are kept at 4°C in closed containers. After 4 days, sample extracts are spotted on a LazWell™ plate, dried and analyzed. The precision and accuracy results of QCs are reported in Table 5. All the results are within the acceptable criteria range for 4 days at 4°C.
Dry Stability of Samples Spotted on LazWell™
Extracted samples are spotted onto a LazWell™ plate, dried and kept at room temperature for 1 hour before analysis. The precision and accuracy results of QCs are reported in Table 5. All the results are within the acceptable criteria range for 1 hour at room temperature.
| Parameters | Dry Stability (1 hour / RT) |
Wet Stability (4 days / 4°C) |
||||
|---|---|---|---|---|---|---|
| QC | QC-L | QC-M | QC-H | QC-L | QC-M | QC-H |
| Conc (ng/mL) | 700 | 2200 | 4200 | 700 | 2200 | 4200 |
| N | 6 | 6 | 6 | 6 | 6 | 6 |
| Mean (ng/mL) | 682.5 | 2086.8 | 4181.2 | 649.6 | 2206.7 | 4191.0 |
| %CV | 5.3 | 7.4 | 6.3 | 4.0 | 3.7 | 1.9 |
| %Nom | 97.5 | 94.9 | 99.6 | 92.8 | 100.3 | 99.8 |
Cross Validation Study
Real patients’ serum samples (N=6) have been tested with this method to correlate with results obtained by traditional LC-MS/MS. The percentage of difference between the values are evaluated. A difference below 15% is obtained. Results are reported in Table 6.
| LC (pg/mL) | Luxon (pg/mL) | %Diff (%) | |
|---|---|---|---|
| M1 | 528.2 | 615.9 | 7.7 |
| M2 | 641.2 | 604.8 | -2.9 |
| M3 | 324.2 | 362.1 | 5.5 |
| M4 | 984.6 | 975.6 | -0.5 |
| M5 | 484.4 | 628.6 | 13.0 |
| M6 | 810.8 | 788.9 | -1.4 |
Conclusion
The Luxon Ion Source combined with Sciex QTrap® 5500 mass spectrometer system allows the ultra-fast (12 seconds per sample) analysis of Vitamin K1 in serum.