Introduction
Ethyl glucuronide is a direct metabolite of ethanol and is formed by the enzymatic conjugation of ethanol with glucuronic acid. Alcohol is normally detected for only a few hours, whereas ethyl glucuronide (ETG) can be detected in the urine for 1 to 3 days. The creatinine concentration in urine is screened to verify the sample’s integrity. Normal creatinine levels (>50 µg/mL) indicate that the test sample is undiluted.
Our goal for this application note is to use an automated sample preparation method for the simultaneous quantification of creatinine (urine dilution marker) and ethyl glucuronide (ETG) in urine using a single operation in LDTD-MS/MS and perform a method comparison study according to the Trevethan approach.
LDTD-MS/MS offers specificity combined with an ultra-fast analysis for an unrivaled screening method. To develop this application, we focused on performing a quick and simple sample preparation. Metabolites are analyzed simultaneously with quantitative screening results obtained in less than 9 seconds per sample. Ethyl glucuronide has been screened at a cutoff of 500 ng/mL
Sample Preparation Method
Automated Sample Extraction
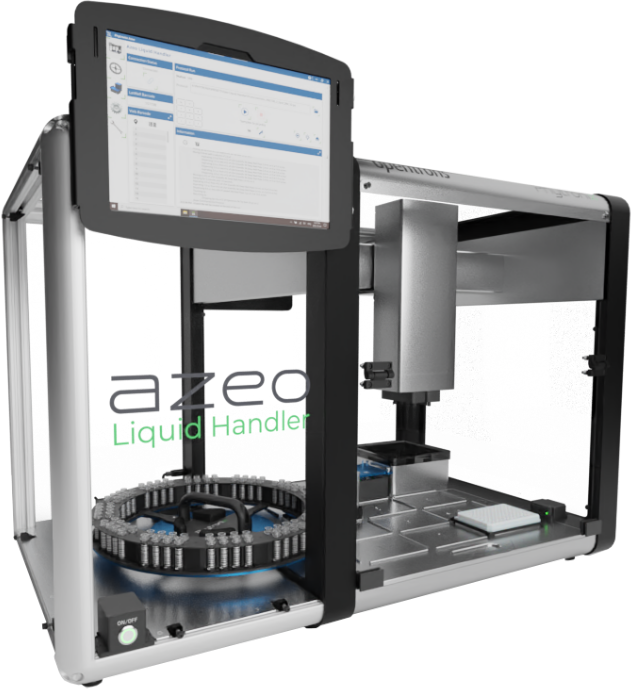
Urine samples were transferred into barcoded tubes, readable by the Azeo Liquid Handler.
Each barcoded vial was scanned by the Azeo Liquid Handler and an automatic batch file was created. The Azeo extraction system (Figure 3) is used to extract the samples using the following conditions:
- 230 µL of Internal standard (ETG-d5:500 ng/mL and Creatinine-d3: 4 µg/mL in dilution buffer) were added to a deep-well plate.
- 20 µL of urine sample were transferred from the vials to the deep-well plate.
- Mix
- 300 µL of Dilution buffer (Methanol:Water:MTBE / 86.5:12.5:1) and 20 µL urine/internal standard mixtures were added in the deep-well plate placed on the Lumo Vortexer.
- Mix
- Spot 4 µL final dilution onto a LazWell™AD plate.
- Dry 4 minutes at 40°C in the Aura LazWell Dryer.
LDTD®-MS/MS Parameters
LDTD
Model: Luxon S-960, Phytronix
Carrier gas: 6 L/min (air)
Laser pattern:
- 6-second ramp to 65% power
- Hold 2 seconds at 65% power
MS/MS
MS model: Q-Trap System® 5500, Sciex
Scan Time: 25 msec
Total run time: 9 seconds per sample
Ionization: APCI
Analysis Method: Negative MRM mode
Table 1 – MRM Transitions for LDTD-MS/MS
| Transition | CE | |
|---|---|---|
| Creatinine | 112 → 68 | -32 |
| Creatinine-d3 | 112 → 68 | -32 |
| ETG | 221 → 75 | -15 |
| ETG-d5 | 226 → 75 | -15 |
Results and Discussion
Initial Cut-off Test
Table 2 shows the suggested screening cut-offs currently used in the industry.
Table 2 – Analytes and Cut-offs
| Analyte | Cut-off |
|---|---|
| Ethyl glucuronide | 500 ng/mL |
| Creatinine | 50 µg/mL |
Precision
Spiked samples around the decision point (50% cut-off: QC-L, cut-off: CO and 200% cut-off: QC-H) and blank solutions are used to validate the precision of the method. The peak area against the internal standard (IS) ratio was used to normalize the signal. Replicate extractions are deposited on a LazWell™ plate and dried before analysis.
The following acceptance criteria were used:
- Each concentration must not exceed 20% CV.
- Mean concentration ± 2 times the standard deviation must not overlap with other concentrations at the cut-off.
For the inter-run precision experiment, each fortified sample set is analyzed in triplicate on five different days. Table 3 shows the inter-run precision results. No overlapping at the cut-off is observed for ETG and the %CV was below 20%. Similar results are obtained for creatinine.
Table 3 – Inter-Run Precision
| ETG | QC-L | Cut-off | QC-H |
|---|---|---|---|
| Conc (ng/ml) | 250 | 500 | 1000 |
| N | 15 | 15 | 15 |
| Mean (ng/mL) | 247.7 | 529.4 | 967.6 |
| SD | 33.8 | 63.4 | 81.9 |
| %CV | 13.6 | 12.0 | 8.5 |
| Mean – 2SD (ng/mL) | 180.1 | 402.5 | 803.8 |
| Mean + 2SD (ng/mL) | 315.3 | 656.3 | 1131.3 |
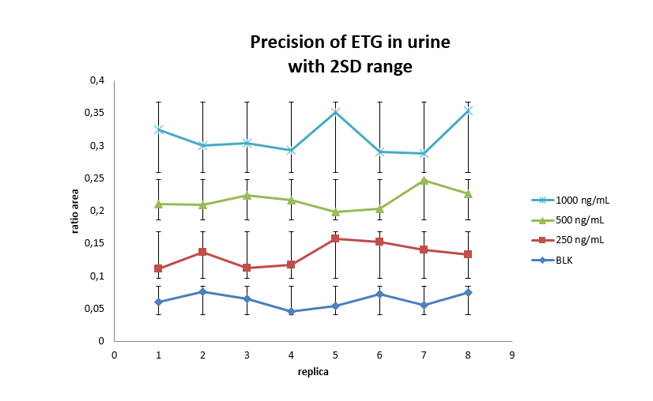
For the intra-run precision experiment, each fortified sample is extracted and analyzed (8 replicates). Area ratio results are plotted using the ± 2 STD error bars. Figure 4 shows the intra-run results for ETG. No overlapping is observed for each concentration and the %CV was below 20%. Similar results are obtained for creatinine.
Multi-Matrix Validation
Forty-five (45) real urine samples from anonymous donors were analyzed. Samples were screened to verify the presence of ETG and the endogenic level of creatinine. The drugs were analyzed with a reference method (LC-MS/MS) and the results were compared to evaluate the method sensitivity, specificity, positive predictive value (PPV), negative predictive value (NPV) and accuracy base on following calculation reported by Trevethan:
| LC-MS/MS | |||
|---|---|---|---|
| Yes | No | ||
| LDTD-MS/MS | Yes | TP (True positive) |
FP (False positive) |
| No | FN (False negative) |
TN (True negative) |
|
Where:
- Sensitivity: (TP / (TP + FN))
- Specificity: (TN / (TN + FP))
- PPV: (TP / (TP + FP))
- NPV: (TN / (TN + FN))
- Accuracy: ((TP+TN) / (TP + FN+TN+FP))
Table 4 shows the analysis result of 45 real samples for ETG.
Table 4 – ETG Results
| ETG |
LC-MS/MS | ||
|---|---|---|---|
| Yes | No | ||
| LDTD-MS/MS | Yes | TP = 23 | FP = 1 |
| No | FN = 0 | TN = 21 | |
Validation results are reported in Table 5 for ETG.
Table 5 – Validation Results for ETG
| Parameters | THC |
|---|---|
| Sensitivity (%) | 100 |
| Specificity (%) | 95 |
| PPV (%) | 96 |
| NPV (%) | 100 |
| Accuracy (%) | 98 |
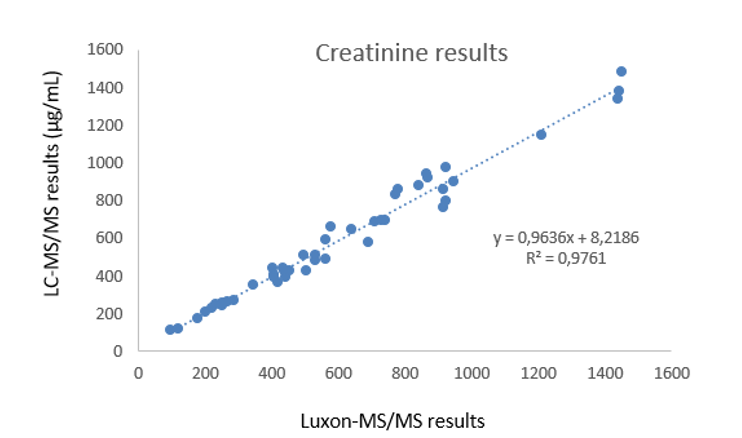
For the analysis of creatinine, all samples have a concentration greater than 50 µg/mL. Creatinine concentrations were evaluated using the isotopic analysis approach for LDTD-MS/MS and LC-MS/MS analysis. Correlation greater than 0.95 was obtained for the method comparison. Figure 5 shows the method comparison curve.
Conclusion
Luxon Ion Source® combined to a Sciex Q-Trap 5500 mass spectrometer system allows ultra-fast (9 seconds per sample) screening of Ethyl glucuronide (ETG) and Creatinine in urine using a simple and automated sample preparation method.