Introduction
The SAMHSA Drug Panel was established to evaluate the presence of the most common drugs of abuse and their metabolites in biological matrices. The panel contains stimulants such as cocaine and amphetamines, depressants such as opiates and opioids, and perturbators such as PCP. Urine, a biological matrix strong in information concerning the health of a patient or the consumption of drugs, is the matrix used in this application note.
Our goal with this application note is to develop a rapid screening method for the SAMHSA panel in human urine using the LDTD technology.
The LDTD-MS/MS system offers specificity combined with an ultra-fast analysis for an unrivaled screening method. To develop this application, we focused on performing a quick and simple sample preparation. Twelve drugs are analyzed simultaneously with quantitative screening results obtained in less than 8 seconds per sample and specific cut-off values were attained for each drug.
Sample Preparation Method
- 50 µL of urine is added in a 2 mL Eppendorf vial.
- 10 µL of internal standard (acetonitrile:methanol 1:1) were added.
- Vortex
- 50 µL of B-One enzyme from Kura were added.
- 40 µL of water were added
- Mix up and down with a pipette.
- Incubate for 15 minutes at room temperature.
- Add 225 µL of extraction buffer (K2HPO4 (500 mM); NaCl (sat) 1:1).
- Add 450 µL of acetonitrile
- Vortex
- Centrifuge
- In a 0.5 mL Eppendorf, mix 100 µL of upper layer with 65 µL of desorption solution (KH2PO4 at 10 mM and BSA at 100 µg/mL in water).
- Spot 6 µL of the mixture onto a LazWell™96 plate
- Dry 4 minutes at 40°C
LDTD®-MS/MS Parameters
LDTD
Model: Luxon S-960, Phytronix
Carrier gas: 6.0 L/min (air)
Laser pattern:
- 6-second ramp to 55% power
- Hold 2 seconds at 55% power
| MS/MS | Positive analysis | Negative analysis |
|---|---|---|
| MS model: | QTrap® System 5500, Sciex | QTrap® System 5500, Sciex |
| Ion Spray Voltage | 6000 | -6000 |
| Temp., GS1 and GS2 | 0 | 0 |
| CUR | 20 | 20 |
| Scan Time | 3 – 20 msec | 3 – 20 msec |
| Analysis Method | Positive MRM mode | Negative MRM mode |
| Drugs | Transition | CE |
|---|---|---|
| 6-monoacetylmorphine | 328.1 → 165.0 | 45 |
| 6-monoacetylmorphine-d6 | 334.0 → 165.0 | 45 |
| Amphetamine | 136.0 → 119.0 | 15 |
| Amphetamine-d5 | 141.1 → 124.0 | 15 |
| Benzoylecgonine | 290.1 → 168.0 | 20 |
| Benzoylecgonine-d8 | 298.0 → 171.1 | 30 |
| MDA | 180.1 → 133.1 | 10 |
| MDA-d5 | 185.1 → 138.3 | 10 |
| MDMA | 194.0 → 163.0 | 20 |
| MDMA-d5 | 199.2 → 165.1 | 20 |
| Methamphetamine | 150.1 → 119.0 | 15 |
| Methamphetamine-d5 | 159.1 → 125.0 | 15 |
| Morphine | 286.1 → 152.0 | 65 |
| Morphine-d9 | 292.1 → 152.0 | 65 |
| Codeine | 300.1 → 152.0 | 70 |
| Codeine-d6 | 306.2 → 152.0 | 70 |
| Oxycodone | 316.1 → 241.1 | 32 |
| Oxycodone-d6 | 322.1 → 247.0 | 35 |
| Oxymorphone | 302.1 → 227.1 | 30 |
| Phencyclidine | 244.2 → 159.2 | 15 |
| Phencyclidine-d5 | 249.0 → 164.1 | 15 |
| Drugs | Transition | CE |
|---|---|---|
| Delta-9-THCC | 343.2 → 245.1 | -35 |
| Delta-9-THCC-d9 | 352.3→ 254.1 | -35 |
Results and Discussion
Initial Cut-Off Test (ng/mL)
A drug list and screening cut-offs suggested in the SAMHSA guidelines can be found in Table 3.
| Analyte | Cut-off (ng/mL) |
|---|---|
| Marijuana (delta-9-THCC) | 50 |
| Cocaine (Benzoylecgonine) | 150 |
| Codeine/Morphine | 300 |
| Hydrocodone/Hydromorphone | 300 |
| Oxycodone/Oxymorphone | 100 |
| Heroin (6-Acetylmorphine) | 10 |
| PCP (Phencyclidine) | 25 |
| Amphetamine/Methamphetamine | 500 |
| MDA/MDMA | 500 |
Precision / Accuracy
Three-point screening curve and two QCs (QC-0.5X and QC-2X) were prepared in synthetic urine and used to validate the method. The peak area against the internal standard ratio was used to normalize the signal. Replicate extractions are deposited on a LazWellTM plate and dried before analysis.
The following acceptance criteria were used:
- Each standard concentration must not exceed 20 %CV.
- Each standard concentration must be ± 20 % of the nominal value (%Biais).
- QC-0.5X cut-off must be detected as negative.
- QC-2X cut-off must be detected as positive.
For the inter-run precision/accuracy experiment, each fortified sample set is analysed in triplicate on five different days. Table 4 shows the inter-run precision and accuracy results. For MDMA, the %CV and %Bias was below 20 %. All QC-0.5X were detected as negative and all QC-2X were detected as positive. Similar results were obtained for the other drugs on the panel.
| MDMA | 1 X | 2 X | 3 X |
|---|---|---|---|
| Conc (ng/mL) | 500 | 1000 | 2500 |
| N | 25 | 25 | 25 |
| Mean (ng/mL) | 520.6 | 945.0 | 2534.3 |
| %CV | 4.3 | 4.5 | 2.6 |
| %Bias | 4.1 | -5.5 | 1.4 |
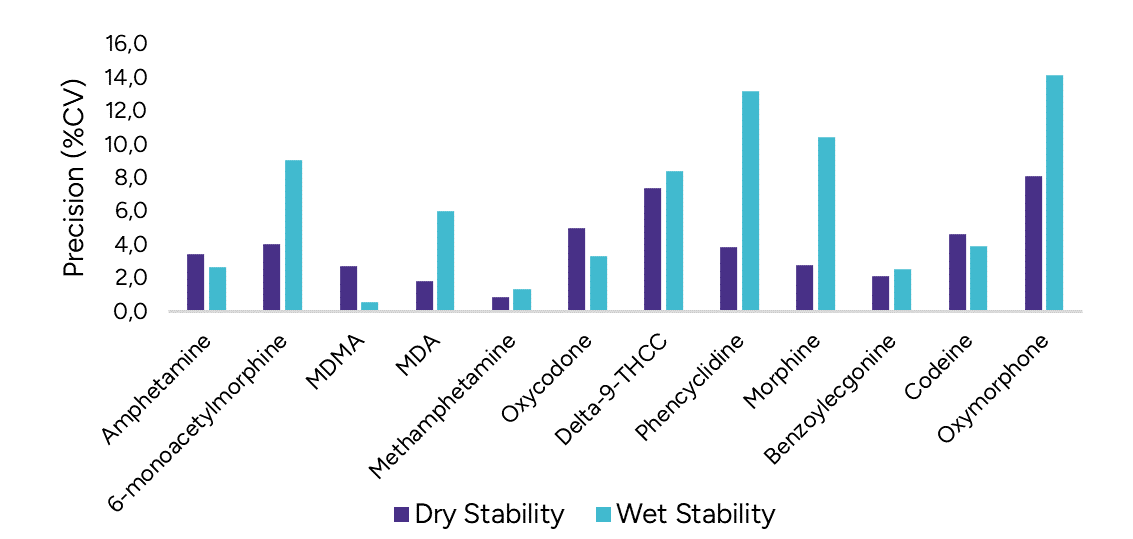
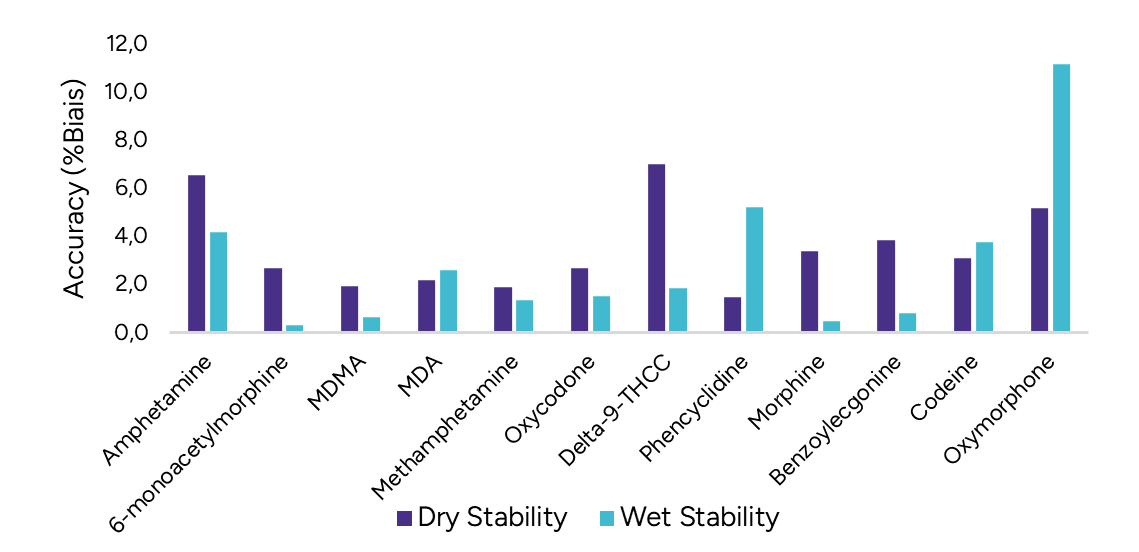
Wet Stability of Sample Extracts
Following the extraction, sample extracts are kept at 4°C in closed containers. After 1 day, sample extracts are spotted on a LazWell™ plate, dried and analyzed by LDTD-MS/MS. The precision and accuracy results of QCs are reported in Figure 3. All the results are within the acceptable criteria range for 1 day at 4°C.
Dry Stability of Samples Spotted on LazWell™
Extracted samples are spotted onto a LazWell™ plate, dried and kept at room temperature for 2 hours before analysis. The precision and accuracy results of QCs are reported in Figure 3. All the results are within the acceptable criteria range for 2 hours at room temperature.
B)
Multi-Matrix Validation
Urines are collected from twenty different volunteers. Samples are screened to cross-verify with LC-MS/MS to assess the method sensitivity, specificity, positive predictive value (PPV), negative predictive value (NPV) and accuracy.
|
LC-MS/MS |
|||
|---|---|---|---|
| Yes | No | ||
| LDTD-MS/MS | Yes | TP (True positive) | FP (False positive) |
| No | FN (False negative) | TN (True negative) | |
Where:
Sensitivity: (TP / (TP + FN))
Specificity: (TN / (TN + FP))
PPV: (TP / (TP + FP))
NPV: (TN / (TN + FN))
Accuracy: ((TP+TN) / (TP + FN+TN+FP))
Table 5 shows the analysis results of 23 spiked matrices for THCC.
| |
LC-MS/MS | ||
|---|---|---|---|
| Yes | No | ||
| LDTD-MS/MS | Yes | TP=2 | FP=0 |
| No | FN=0 | TN=21 | |
Validation results are reported in Figure 6 for THCC. Similar results are obtained for the other drugs. No false negative was observed.
| Parameters | THCC |
|---|---|
| Sensitivity (%) | 100 |
| Specificity (%) | 100 |
| PPV (%) | 100 |
| NPV (%) | 100 |
| Accuracy (%) | 100 |
Conclusion
The Luxon Ion Source® combined with the Sciex QTrap® 5500 mass spectrometer system enables high-throughput analysis of the SAMHSA drug panel in urine.