Introduction
Vitamin C (Ascorbic acid, AA) is an important compound that engages in many physiological activities in living organisms (synthesis of collagen, acts as an antioxidant, metabolisms and synthesis of adrenaline, prevention, and treatment of scurvy and cold). In the presence of moisture, air, heat, light and oxygen, ascorbic acid transforms into its oxidized form, dehydroascorbic acid (DHAA). The total Vitamin C concentration in a plasma sample is defined as the sum of AA and DHAA.
Our goal for this application note is to use an automated sample preparation method for the quantification of total vitamin C in plasma using a single operation with the Luxon Ion Source®, based on the LDTD® technology.
LDTD-MS/MS offers specificity combined with an ultra-fast analysis for an unrivaled quantification method. To develop this application, we focused on performing a quick and simple sample preparation. Vitamin C is analyzed, and results are obtained in less than 9 seconds per sample.
Sample Preparation Method
Automated Sample Extraction
Due to the instability of ascorbic acid, plasma samples were spiked and stabilized with a sulfuric acid solution (0.2N). A mixture of plasma: H2SO4 (0.2N) / 1:1 was used. Stabilized samples were transferred into barcoded tubes, readable by the Azeo extraction system.
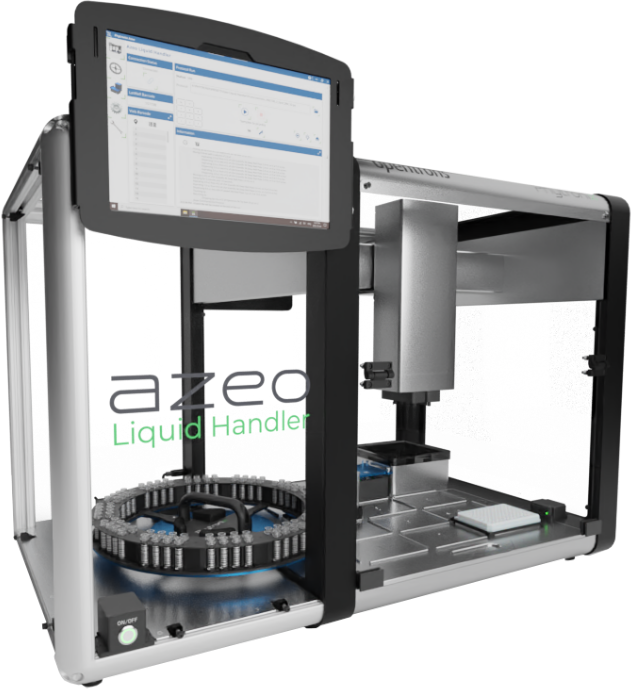
Each barcoded vial was scanned by the Azeo Liquid Handler and an automatic batch file was created. The Azeo extraction system (Figure 3) is used to extract the samples using the following conditions:
- 40 µL of stabilized plasma sample were transferred from the vials to a deep-well plate.
- 20 µL of Internal standard (Ascorbic acid-13C6, 50 µg/mL in H2SO4 (0.2N)) were added to each sample.
- Mix
- 5 µL of plasma/IS, 30 µL of extraction buffer (KH2PO4, 1 mM) and 300 µL of acetonitrile were added to a second deep-well plate.
- Mix
- Centrifuge 5 minutes/5000 rpm
- Spot 4 µL of the upper layer phase onto a LazWell™ 96 plate
- Dry 3 minutes at 40°C in the Aura LazWellTM Dryer
LDTD®-MS/MS Parameters |
||||||||||||||||||||||||||||||||
| Shimadzu | Thermo | Sciex | ||||||||||||||||||||||||||||||
|---|---|---|---|---|---|---|---|---|---|---|---|---|---|---|---|---|---|---|---|---|---|---|---|---|---|---|---|---|---|---|---|---|
| LDTD
Model: Luxon SH-960, Phytronix Carrier gas: 3 L/min (air) with water infusion at 10 mL/min Laser pattern: 6-second ramp to 45% power
MS/MS MS model: LCMS-8060, Shimadzu Scan Time: 50 msec Total run time: 9 seconds per sample Ionization: APCI Analysis Method: Negative MRM mode |
LDTD
Model: Luxon T-960, Phytronix Carrier gas: 3 L/min (air) Laser pattern: 6-second ramp to 45% power
MS/MS MS model: Thermo Vantage, Thermo Fisher Scientific Scan Time: 50 msec Total run time: 9 seconds per sample Ionization: APCI Analysis Method: Negative MRM mode |
LDTD
Model: Luxon S-960, Phytronix Carrier gas: 3 L/min (air) Laser pattern: 6-second ramp to 45% power
MS/MS MS model: QTrap® System 5500, Sciex Scan Time: 50 msec Total run time: 9 seconds per sample Ionization: APCI Analysis Method: Negative MRM mode |
||||||||||||||||||||||||||||||
| Note: All ascorbic acid is transformed to DHAA in the APCI source. No additional step of reduction or oxidation is needed during the sample preparation.
|
||||||||||||||||||||||||||||||||
| Table 1 – MRM transitions for LDTD-MS/MS | ||||||||||||||||||||||||||||||||
| Shimadzu | Thermo | Sciex | ||||||||||||||||||||||||||||||
|
|
|
||||||||||||||||||||||||||||||
The following sections are taken from the application note 2106B for Shimadzu MS. For all the applications of « Analysis of Total Vitamin C in Plasma » (Shimadzu,Thermo and Sciex), please download the PDF attached to this article.
Results and Discussion
Data preparation process (applies only to Shimadzu mass spectrometer)
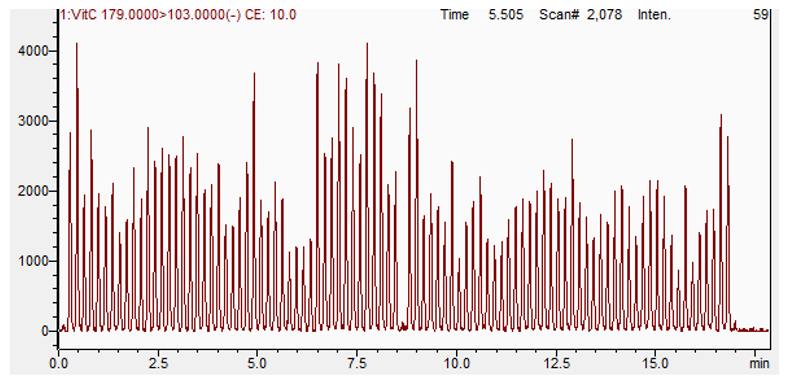
Mass spectrometers are data acquisition systems that were not designed to deal with few second signal per sample. The synchronization sequence adds 6 to more than 15 seconds between each sample. To bypass this, all samples are acquired in a single file (Figure 4). To allow the analysis of such data, Cascade software is designed to detect, split and integrate every sample peak acquired in a single file.
Validation Test
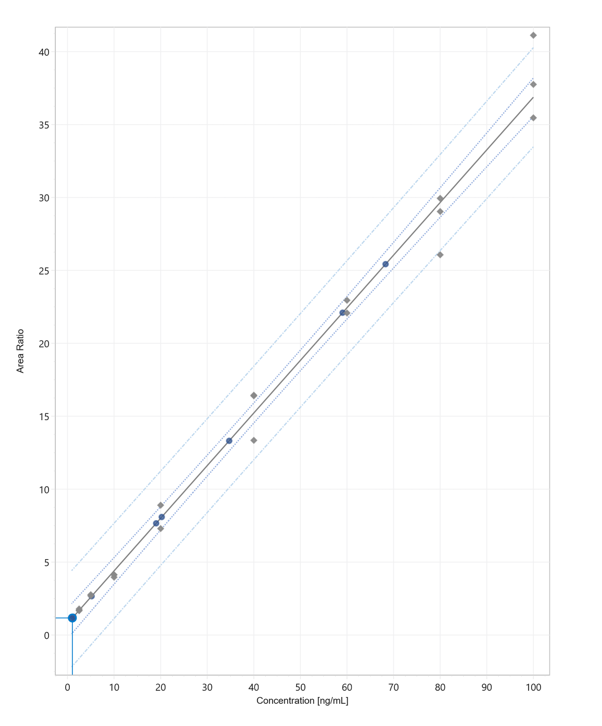
Calibration curves ranging from 3 to 100 µg/mL and QCs were prepared in an AA-depleted plasma (plasma kept at room temperature/exposed to light for 4 days). Replicate extractions were deposited onto a LazWell™ plate and dried before analysis. The peak area against the internal standard (IS) ratio was used to normalize the signal.
Linearity
The calibration curves were plotted using the peak area ratio and the nominal concentration of standards. For the linearity test, the following acceptance criteria was used:
- Linear regression (r2) must be ≥ 99
Figure 5 shows a typical calibration curve result for Vitamin C.
Precision and Accuracy
For the accuracy and precision evaluation, the following acceptance criteria were used:
- Each concentration must not exceed 15% CV
- Each concentration must be within 100 ± 15% of the nominal concentration
DHAA was spiked at 50 µg/mL and analyzed as a QC. Table 2 shows the intra-run precision and accuracy results for DHAA-QC. The obtained %CV was below 15% and the accuracy was within 15% of the nominal value.
For the inter-run precision and accuracy experiment, each QC was analyzed in sextuplicate, on five different days. Table 3 shows the inter-run precision and accuracy results for Vitamin C. The obtained %CV was below 15% and the accuracy was within 15% of the nominal value.
Table 2 – Intra-Run Precision and Accuracy of Vitamin C
| Vitamin C | QC-M (DHAA) |
|---|---|
| Conc (µg/mL) | 50.0 |
| N | 6 |
| Mean (µg/mL) | 42.8 |
| %CV | 2.8 |
| %Nom | 85.6 |
Table 3 – Inter-Run Precision and Accuracy of Vitamin C
| Vitamin C | QC-L | QC-M | QC-H |
|---|---|---|---|
| Conc (µg/mL) | 3.0 | 50.0 | 75.0 |
| N | 30 | 30 | 30 |
| Mean (µg/mL) | 2.9 | 49.7 | 76.2 |
| %CV | 6.0 | 3.6 | 3.4 |
| %Nom | 96.2 | 99.3 | 101.6 |
Wet Stability of Sample Extracts
Following the extraction, sample extracts are kept at 4°C in closed containers. After 1 day, sample extracts are spotted on a LazWell™ plate, dried and analyzed. Precision and accuracy of QC samples are reported in Table 4. All the results are within the acceptable criteria range for 1 day at 4°C.
Dry Stability of Samples Spotted in LazWell™
Extracted samples are spotted onto a LazWell™ plate, dried and kept at room temperature for 1 hour before analysis. The precision and accuracy results of QC samples are reported in Table 4. All the results are within the acceptable criteria range for 1 hour at room temperature.
Table 4 – Wet and Dry Stability of Vitamin C
| Parameters | Dry stability (1 hour / RT) | Wet stability (1 day / 4°C) | ||||
|---|---|---|---|---|---|---|
| QC | QC-L | QC-M | QC-H | QC-L | QC-M | QC-H |
| Conc. (µg/mL) | 3.0 | 50.0 | 75.0 | 3.0 | 50.0 | 75.0 |
| N | 6 | 6 | 6 | 6 | 6 | 6 |
| Mean (µg/mL) | 3.1 | 49.4 | 76.6 | 3.2 | 49.8 | 80.6 |
| %CV | 3.4 | 2.5 | 1.2 | 6.3 | 3.2 | 2.9 |
| %Nom | 101.7 | 98.7 | 102.1 | 105.0 | 99.6 | 107.5 |
Conclusion
The Luxon Ion Source combined with Shimadzu LCMS-8060 mass spectrometer system allows the ultra-fast (6 seconds per sample) analysis of total Vitamin C in plasma.