Introduction
In 2019, the US Department of Health and Human Services (via the SAMHSA agency) has established scientific and technical guidelines for federal workplace drug testing programs in oral fluids (Federal Register / Vol. 84, No. 207, 2019). Our goal for this application note is to use an automated sample preparation method for the SAMHSA drug panel in oral fluids using a single operation in LDTD-MS/MS.
The LDTD-MS/MS system offers specificity combined with an ultra-fast analysis for an unrivaled screening method. To develop this application, we focused on performing a quick and simple sample preparation. Fourteen drugs are analyzed simultaneously with quantitative screening results obtained in less than 8 seconds per sample and specific cut-off values were attained for each drug.
Sample Preparation Method
Sample Collection
Oral fluids were collected using the Quantisal® device. After the collection of the oral fluid, the pad is transferred into a tube containing an extraction buffer. During this process, oral fluids are diluted by a factor of 4.
Automated Sample Extraction (SALLE)
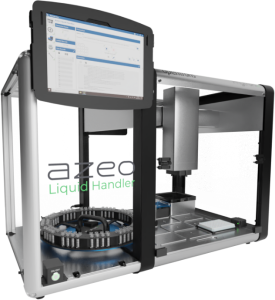
Each barcoded vial was scanned by the Azeo Liquid Handler and an automatic batch file was created. Then, the automated system (Figure 3) is used to extract the samples using the following conditions:
- 20 µL of Internal standard in acetonitrile
- 100 µL of Oral fluid sample
- Vortex
- 100 µL of NaCl (sat): NaOH (1N) / (96:4)
- Vortex
- 280 µL of acetonitrile
- Vortex and Centrifuge (3000 rpm/2 min.)
- Mix 15 µL of the upper layer with 5 µL desorption solution
- Spot 8 µL of mixture on a LazWell™96 plate
- Dry 4 minutes at 40°C
LDTD®-MS/MS Parameters
LDTD
Model: Luxon SH-960, Phytronix
Carrier gas: 6.0 L/min (air) with water infusion at 20 µL/sec
Laser pattern:
- 6-second ramp to 65% power
- Hold 2 seconds at 65% power
MS/MS
MS model: LCMS-8060, Shimadzu
Scan Time: 5 msec
Ionization: APCI
Analysis Method: Positive MRM mode
| Drugs | Transition | CE |
|---|---|---|
| Amphetamine | 136.1 → 119.1 | 12 |
| Amphetamine-d5 | 141.1 → 124.1 | 12 |
| Methamphetamine | 150.1 → 119.1 | 15 |
| Methamphetamine-d9 | 159.1 → 125.1 | 15 |
| MDA | 180.1 → 133.0 | 20 |
| MDA-d5 | 185.1 → 138.1 | 20 |
| MDMA | 194.1 → 133.1 | 25 |
| MDMA-d5 | 199.2 → 136.1 | 25 |
| PCP | 244.2 → 159.1 | 20 |
| PCP-d5 | 249.3 → 164.0 | 20 |
| MOR / HYM | 286.1 → 152.0 | 70 |
| MOR-d6 | 292.1 → 152.0 | 70 |
| COD / HYC | 300.1 → 152.0 | 70 |
| COD-d6 | 306.1 → 152.0 | 70 |
| Cocaine | 304.1 → 182.1 | 25 |
| Cocaine-d3 | 307.2 → 185.2 | 25 |
| OXM | 302.1 → 227.0 | 40 |
| OXC | 316.1 → 241.0 | 35 |
| OXC-d6 | 322.2 → 247.0 | 35 |
| 6-AM | 328.1 → 165.0 | 50 |
| 6-AM-d6 | 334.1 → 165.0 | 50 |
| THC | 315.2 → 193.1 | 25 |
| THC-d3 | 318.2 → 196.1 | 25 |
Results and Discussion
Initial Cut-Off Test (ng/mL)
A drug list and screening cut-offs suggested in the SAMHSA guidelines can be found in Table 2.
| Analyte | Cut-off (ng/mL) |
|---|---|
| Marijuana (THC) | 4 |
| Cocaine | 15 |
| Codeine / Morphine | 30 |
| Hydrocodone / Hydromorphone | 30 |
| Oxycodone / Oxymorphone | 30 |
| 6-Acetylmorphine | 4 |
| Phencyclidine | 10 |
| Amphetamine / Methamphetamine | 50 |
| MDA / MDMA | 50 |
Data Preparation Process
Data acquisition systems of mass spectrometers were not designed to deal with signals of only a few seconds per sample. The synchronization sequence adds 6 to more than 15 seconds between each sample. To bypass this, all samples are acquired in a single file (Figure 4). To allow the analysis of such data, Cascade™ software is designed to detect, split, and integrate every sample peak acquired in a single file.

Precision
Spiked samples around the decision point (50% cut-off: QC-L, cut-off: CO and 200% cut-off: QC-H) and blank solutions are used to validate the precision of the method. The peak area against the internal standard (IS) ratio was used to normalize the signal. Replicate extractions are deposited onto a LazWell™ plate and dried before analysis.
The following acceptance criteria were used:
- Each concentration must not exceed 20% CV
- The mean concentration ± 2 times the standard deviation must not overlap with other concentrations at the cut-off.
For the inter-run precision experiment, each fortified sample set is analyzed in triplicate on five different days. Table 3 shows the inter-run precision results. No overlapping at the cut-off is observed for THC and the %CV was below 20%. Similar results are obtained for the other drugs in the panel.
| QC-L | CO | QC-H | |
|---|---|---|---|
| Conc (ng/mL) | 2 | 4 | 8 |
| N | 15 | 15 | 15 |
| Mean (ng/mL) | 2.01 | 3.93 | 8.02 |
| SD | 0.271 | 0.545 | 0.909 |
| %CV | 13.5 | 13.7 | 11.3 |
| Mean – 2SD (ng/mL) | 1.47 | 2.88 | 6.2 |
| Mean + 2SD (ng/mL) | 2.55 | 5.06 | 9.84 |
Wet Stability of Sample Extracts
Following the extraction, the upper layer was mixed with a desorption solution and kept at 4°C in closed containers. After 1 day, sample extracts are spotted on a LazWell™ plate, dried and analyzed. Precision of QC samples are reported in Table 4. All the results are within the acceptable criteria range for 1 day at 4°C.
Dry Stability of Samples Spotted on LazWell™
Extracted samples are spotted onto a LazWell™ plate, dried and kept at room temperature for 1 hour before analysis. The precision results of QC samples are reported in Table 4. All the results are within the acceptable criteria range for 1 hour at room temperature.
| Parameters | Dry Stability (1 hour / RT) |
Wet Stability (1 day / 4°C) |
||||
|---|---|---|---|---|---|---|
| QC | QC-L | QC-M | QC-H | QC-L | QC-M | QC-H |
| Conc (ng/mL) | 2 | 4 | 8 | 2 | 4 | 8 |
| N | 3 | 3 | 3 | 3 | 3 | 3 |
| Mean (ng/mL) | 1.93 | 4.21 | 7.86 | 2.10 | 3.70 | 8.20 |
| %CV | 9.9 | 5.2 | 11.0 | 14.2 | 3.0 | 5.8 |
Multi-Matrix Validation
Oral fluids are collected from eight different volunteers. Samples are screened to verify the presence of each analyte (all samples were negative). Drugs are spiked at 50% cut-off (QC-L) and 200% cut-off (QC-H) and screened as unknown to verify the method sensitivity, specificity, positive predictive value (PPV), negative predictive value (NPV) and accuracy.
|
Spiked Sample |
|||
|---|---|---|---|
| Yes | No | ||
| LDTD-MS/MS | Yes | TP (True positive) | FP (False positive) |
| No | FN (False negative) | TN (True negative) | |
Where:
Sensitivity: (TP / (TP + FN))
Specificity: (TN / (TN + FP))
PPV: (TP / (TP + FP))
NPV: (TN / (TN + FN))
Accuracy: ((TP+TN) / (TP + FN+TN+FP))
Table 5 shows the analysis results of 16 spiked matrices for THC.
| |
LC-MS/MS | ||
|---|---|---|---|
| Yes | No | ||
| LDTD-MS/MS | Yes | TP=8 | FP=0 |
| No | FN=0 | TN=8 | |
Validation results are reported in Table 6 for THC. Similar results are obtained for the other drugs.
| Parameters | THC |
|---|---|
| Sensitivity (%) | 100 |
| Specificity (%) | 100 |
| PPV (%) | 100 |
| NPV (%) | 100 |
| Accuracy (%) | 100 |
Conclusion
Luxon Ion Source® combined to a Shimadzu LCMS-8060 mass spectrometer system allows ultra-fast (8 seconds per sample) screening of the SAMHSA drug panel in oral fluids using a simple and automated sample preparation method.