Introduction
The rapid quantification of cortisol in oral fluids can be useful for the screening of adrenal pathologies like Cushing’s syndrome1,2. Saliva analysis of cortisol can be use as biomarker for stress assessment. It was shown that salivary cortisol can provide important information about hypothalamic-pituitary-adrenal (HPA) axis activity under normal and stress conditions3.
Our goal for this application note is to develop a diagnostic tool to rapidly quantify cortisol in saliva, which will allow the rapid diagnosis of certain adrenal pathologies or as a biomarker for stress assessment.
LDTD-MS/MS offers specificity combined with an ultra-fast analysis for an unrivaled quantification method. To develop this application, we focused on performing an efficient sample preparation, which will increase the speed of the analysis process.
Sample Preparation Method
Stock solutions of Cortisol were prepared in methanol at 1 mg/mL. Then, artificial saliva samples were spiked to generate a calibration curve and QCs.
Automated Sample Extraction
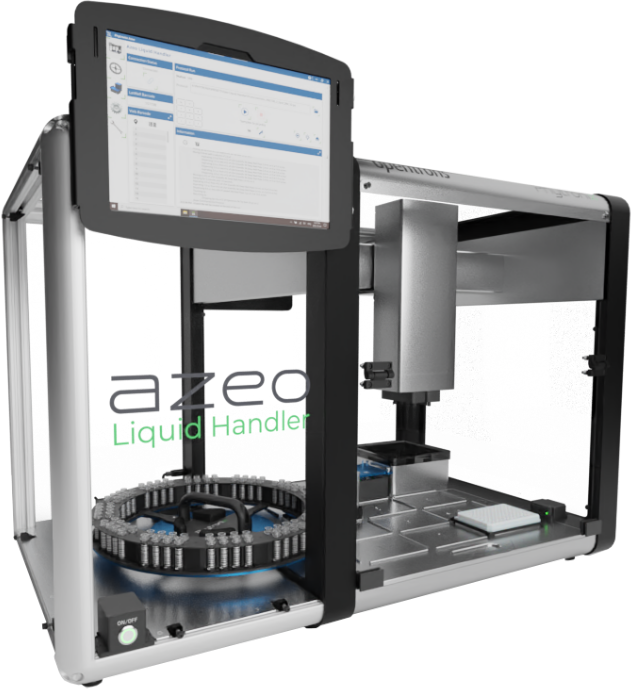
The Azeo Liquid Handler (Figure 3) is used to extract the samples using the following conditions:
- 8 µL of Internal standard in methanol
- 400 µL of Saliva sample.
- Vortex.
- 320 µL of Buffer (KH2PO4, 1M).
- Vortex.
- 800 µL of Methyl-tert-butyl ether
- Vortex and Centrifuge (3000 rpm/2 min.).
- Transfer 400 µL of the upper layer in a borosilicate test tube
- Evaporate to dryness.
- Add 120 of Methanol/Water (1:1) mixture.
- Vortex.
- Spot 6 µL of mixture on a LazWell™ CORT plate (96 wells).
- Dry 5 minutes at 40°C
LDTD®-MS/MS Parameters
LDTD
Model: Luxon S-960, Phytronix
Carrier gas: 6.0 L/min (air)
Laser pattern:
- 6-seconds ramp to 75% power
- 2-seconds hold
MS/MS
MS model: QTrap® System 5500, Sciex.
IonSpray Voltage: -4200
Temperature, GS1 and GS2 set to zero.
Scan Time: 50 msec
Analysis Method: Negative MRM mode
Table 1 – MRM transitions for LDTD-MS/MS
| Transition | CE (V) | |
|---|---|---|
| Cortisol | 361.2 → 331.1 | -15 |
| Cortisol-d6 | 367.1 → 335.0 | -15 |
Results and Discussion
Validation Test
Calibration curves ranging from 1 to 20 ng/mL were prepared in synthetic saliva. Sets of QCs were prepared (LLOQ, QCL, QCM, QCH, and ULOQ) in synthetic saliva. Replicate extractions were deposited onto a LazWell™ plate and dried before analysis. The peak area against the internal standard (IS) ratio was used to normalize the signal.
Linearity
The calibration curves were plotted using the peak area ratio and the nominal concentration of standards. For the linearity test, the following acceptance criteria was used:
- Linear regression (r) must be ≥ 0.995
Table 2 shows the inter-day correlation coefficients for Cortisol. Values greater than 0.995 are obtained. Figure 4 shows a typical calibration curve result for Cortisol.
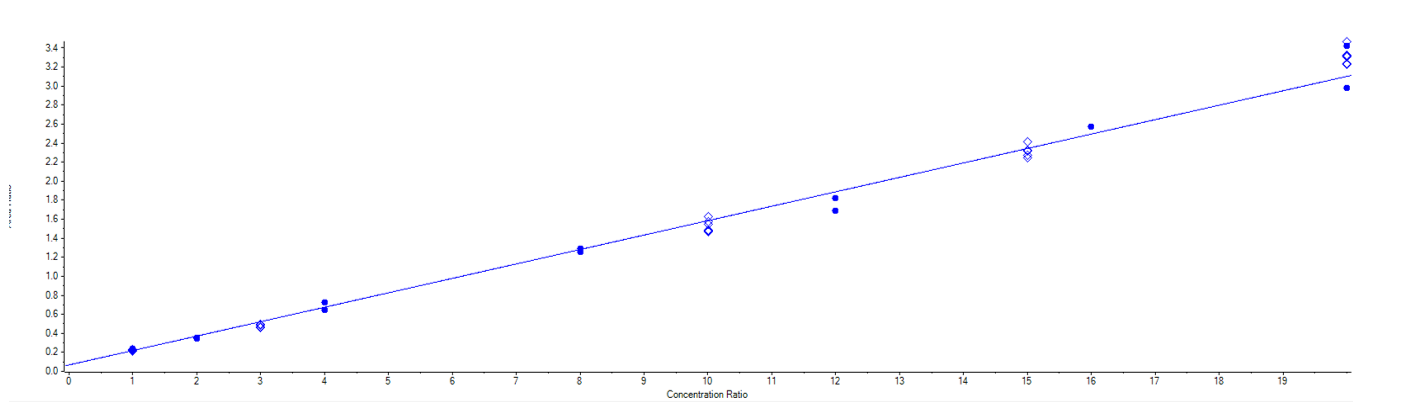
Table 2 – Inter-day calibration curve correlation coefficients
| Cortisol | R | |
|---|---|---|
| Curve 1 | Y = 0.15169 X + 0.06757 | 0.99623 |
| Curve 2 | Y = 0.15002 X + 0.066340 | 0.99700 |
| Curve 3 | Y = 0.13005 X + 0.06599 | 0.99741 |
| Curve 4 | Y = 0.08740 X + 0.06370 | 0.99789 |
| Curve 5 | Y = 0.11970 X + 0.05502 | 0.99517 |
Precision and Accuracy
For the accuracy and precision evaluation, the following acceptance criteria were used:
- Each concentration must not exceed 15%CV.
- Each concentration must be within 100 ± 15% of the nominal concentration.
For the intra and inter-run precision and accuracy experiment, each QC was analyzed in sextuplicate, on four different runs. Table 3 and 4 show the intra and inter-run precision and accuracy results for Cortisol. The obtained %CV was below 15% and the accuracy was within 15% of the nominal value.
Table 3 – Intra-Run Precision and Accuracy of Cortisol
| LLOQ | QCL | QCM | QCH | ULOQ | |
|---|---|---|---|---|---|
| Conc (ng/mL) | 1 | 3 | 10 | 15 | 20 |
| N | 6 | 6 | 6 | 6 | 6 |
| Mean (ng/mL) | 1.0 | 2.7 | 9.6 | 14.9 | 21.4 |
| %CV | 5.0 | 3.5 | 4.3 | 3.0 | 2.6 |
| % Nom | 102.0 | 89.9 | 96.3 | 99.5 | 107.0 |
Table 4 – Inter-Run Precision and Accuracy of Cortisol
| LLOQ | QCL | QCM | QCH | ULOQ | |
|---|---|---|---|---|---|
| Conc (ng/mL) | 1 | 3 | 10 | 15 | 20 |
| N | 12 | 30 | 30 | 30 | 12 |
| Mean (ng/mL) | 1.0 | 2.8 | 9.4 | 14.9 | 20.8 |
| %CV | 7.6 | 11.0 | 7.4 | 9.6 | 10.9 |
| % Nom | 104.2 | 93.3 | 94.2 | 99.3 | 104.0 |
Wet Stability of Sample Extracts
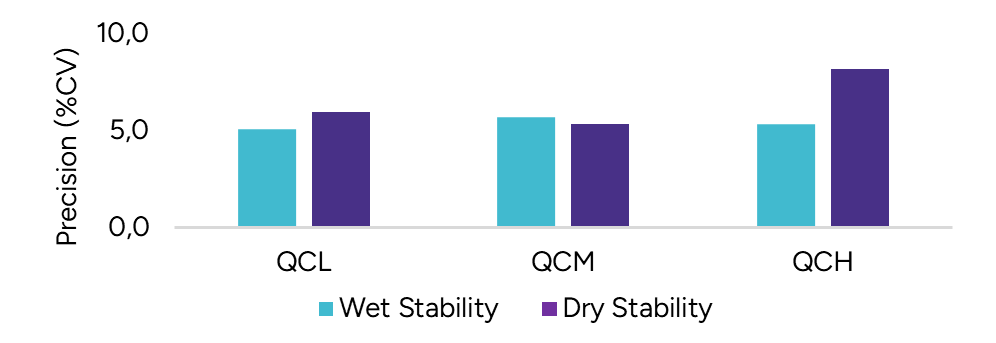
Following the extraction, sample extracts are kept at 4°C in closed containers protected from light. After five days, sample extracts are spotted on a LazWell™ plate, dried and analyzed. The precision and accuracy results of QCs in synthetic saliva samples are reported in Figure 5. All the results are within the acceptable criteria range for one week at 4°C.
Dry Stability of Samples Spotted in LazWell™
Extracted samples are spotted onto a LazWell™ plate, dried and kept at room temperature for 2 hours before analysis. The precision and accuracy results of QCs in synthetic saliva samples are reported in Figure 5. the results are within the acceptable criteria range for 2 hours at room temperature.
A)
 |
|
B) 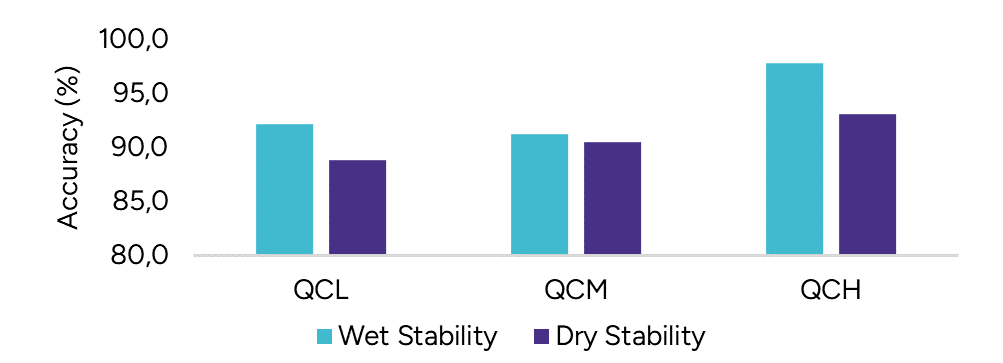 |
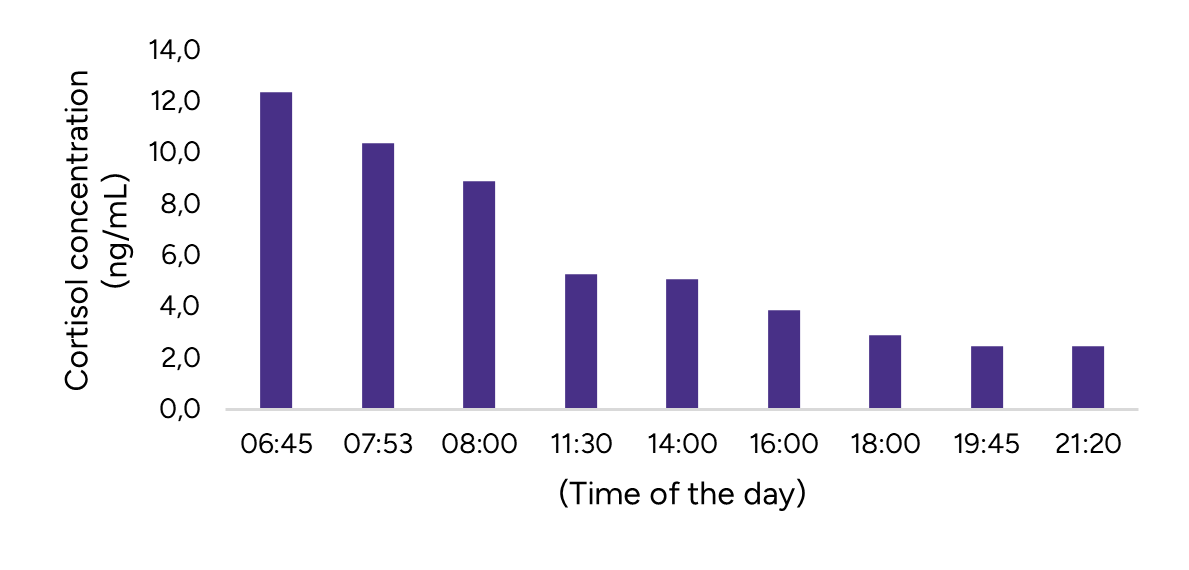
Cortisol study
The study of cortisol in saliva over a period of 24 hours was carried out. The results obtained agree with those obtained in Chan et al. (2020). The level of cortisol rises rapidly when an individual wakes up and decreases throughout the day until bedtime.
Conclusion
The Luxon Ion Source combined with the Sciex QTrap® 5500 mass spectrometer system enables the rapid analysis of cortisol in oral fluids in less than 10 seconds.