Introduction
Over the last 10 years, the quantitation of immunosuppressive drugs has been subject to continuous improvements in analytical methods to optimize cost, time, and accuracy of results. The transition from immunoassay to liquid chromatography coupled with tandem mass spectrometry (LC-MS/MS) has significantly improved all these criteria but has not reduced the analytical time below a minute. The Laser Diode Thermal Desorption (LDTD) represents a technological breakthrough that removes the chromatographic step and significantly increases the analytical throughput for the quantitation of Tacrolimus (TAC), Sirolimus (SIR), Everolimus (EVE) and Cyclosporin A (CsA) in the field of clinical analysis.
Our goal for this application note is to use an automated sample preparation method for an immunosuppressive drug panel in whole blood using a single operation in LDTD-MS/MS.
LDTD-MS/MS offers specificity combined with an ultra-fast analysis for an unrivaled analytical method. To develop this application, we focused on performing an automated sample preparation. Four drugs are analyzed simultaneously with quantitative results obtained in less than 9 seconds per sample.
Sample Preparation Method
Automated Sample Extraction
An automated process (Figure 1) is used to extract the samples using the following conditions:
- 100 µL of whole blood sample
- 100 µL of Internal standard
- Vortex
- 40 µL of ZnSO4 (1N)
- Vortex
- 145 µL of Methanol
- Vortex and centrifuge
- Mix 200µL of upper layer with 67 µL water and 167 µL MTBE
- Phase separation by gravity.
- Spot 7.5 µL of the MTBE layer : Desorption buffer (3:5) on a LazWell™96 plate
- Dry 3 minutes at 40°C
LDTD®-MS/MS Parameters
LDTD
Model: Luxon S-960, Phytronix
Carrier gas: 3 L/min (air + infusion of NH4OH at 3 µL/min)
Laser pattern:
- 6-second ramp to 65% power
- Hold 2 seconds at 65% power
MS/MS
MS model: Q-Trap System® 5500, Sciex
Scan Time: 20 msec
Total run time: 9 seconds per sample
Ionization: APCI
Analysis Method: MRM mode
Table 1 – Positive MRM transitions for LDTD-MS/MS
| Transition | CE | |
|---|---|---|
| Sirolimus | 931.5 → 864.55 | 25 |
| Sirolimus-d3 | 934.5 → 864.55 | 25 |
| Everolimus | 975.6 → 908.55 | 25 |
| Everolimus-d4 | 979.6 → 912.55 | 25 |
| Tacrolimus | 821.4 → 768.45 | 25 |
| Ascomycin (IS) | 809.4 → 756.45 | 25 |
| Cyclosporin-A | 1219.9 → 1184.9 | 20 |
| Cyclosporin-D (IS) | 1233.9 → 1198.9 | 20 |
Results and Discussion
Linearity
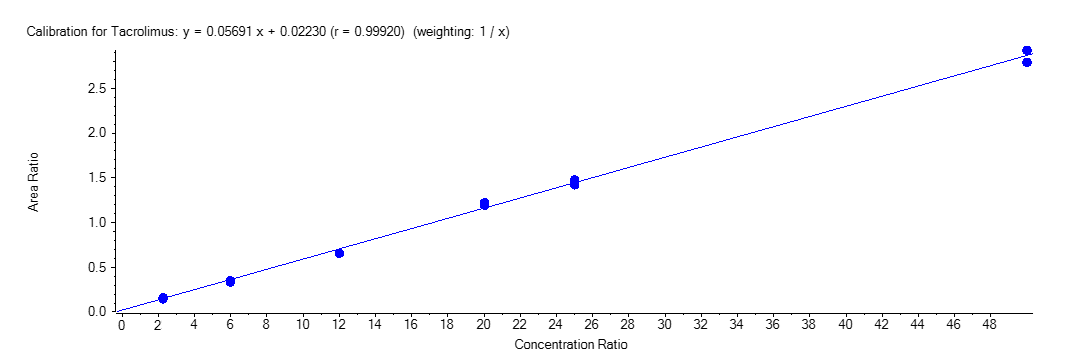
For each analytical run, calibrators and QC samples were freshly prepared. 100 µL of working solution were spiked in 900 µL of drug-free whole blood to achieve a calibration standard ranging from 2.25 to 50 ng/mL for TAC, SIR and EVE. For CsA, calibration standards from 25 to 1000 ng/mL were obtained. Figure 4 shows a typical calibration curve obtained for Tacrolimus. All equations for the calibration curves were weighted according to 1/x least-square linear and regression correlation coefficients (r) obtained were between 0.99635 and 0.99950.
Precision and Accuracy
Spiked samples at QC level (QC-L: 6 ng/mL, QC-M:20 ng/mL and QC-H: 25 ng/mL) for TAC, SIR and EVE. For CsA, QC levels (QC-L: 125 ng/mL, QC-M: 500 ng/mL and QC-H: 800 ng/mL) are used to validate the precision and accuracy of the method. The peak area against the internal standard (IS) ratio was used to normalize the signal. Replicate extractions are deposited on a LazWell™ plate and dried before analysis.
Following acceptance criteria were used:
- Each concentration must not exceed 15% CV
- Mean concentration ± 15% of nominal concentration
For the inter-run precision experiment, each fortified sample set is analyzed in sextuplicate on five different runs. Table 2 shows the inter-run precision results. Accuracy within 15% of nominal value and a %CV below 15% are reached. Similar results are obtained for the other drugs.
Table 2 – Inter-Run Precision and Accuracy for TAC
| Tacrolimus | QC-L | QC-M | QC-H |
|---|---|---|---|
| Conc (ng/mL) | 6 | 20 | 25 |
| N | 30 | 30 | 30 |
| Mean (ng/mL) | 5.5 | 20.5 | 25.0 |
| %CV | 5.9 | 2.1 | 3.0 |
| %Nom | 91.4 | 102.4 | 100.1 |
For the intra-run precision experiment, each fortified sample is extracted and analyzed (6 replicates). Table 3 shows the results. Accuracy within 15% of nominal value and a %CV below 15% are reached. Similar results are obtained for the other drugs.
Table 3 – Intra-Run Precision and Accuracy for TAC
| Tacrolimus | QC-L | QC-M | QC-H |
|---|---|---|---|
| Conc (ng/mL) | 6 | 20 | 25 |
| N | 6 | 6 | 6 |
| Mean (ng/mL) | 5.4 | 20.3 | 24.9 |
| %CV | 2.1 | 2.0 | 1.7 |
| %Nom | 90.6 | 101.3 | 99.7 |
Matrix Effect Evaluation
The variability from different sources of matrix was evaluated in blood samples of six individual donors spiked at low quality control (QC-L) levels. The inter-individual variation in matrix effect did not affect the precision and accuracy of the assay. All results are within the acceptance criteria. Tacrolimus results are reported in Table 4. Similar results are obtained for the other drugs.
Table 4 – Multi-matrix evaluation results
| Analytes | Sample | Conc. (ng/mL) |
N | Mean (ng/mL) |
Precision (%) |
Accuracy (%) |
|---|---|---|---|---|---|---|
| TAC |
M1 | 6 | 6 | 5.7 | 1.1 | 95.0 |
| M2 | 6 | 6 | 5.2 | 1.7 | 86.7 | |
| M3 | 6 | 6 | 5.8 | 2.2 | 96.7 | |
| M4 | 6 | 6 | 5.6 | 3.0 | 93.3 | |
| M5 | 6 | 6 | 5.5 | 3.3 | 91.7 | |
| M6 | 6 | 6 | 5.8 | 4.0 | 96.7 |
Cross-Validation Study
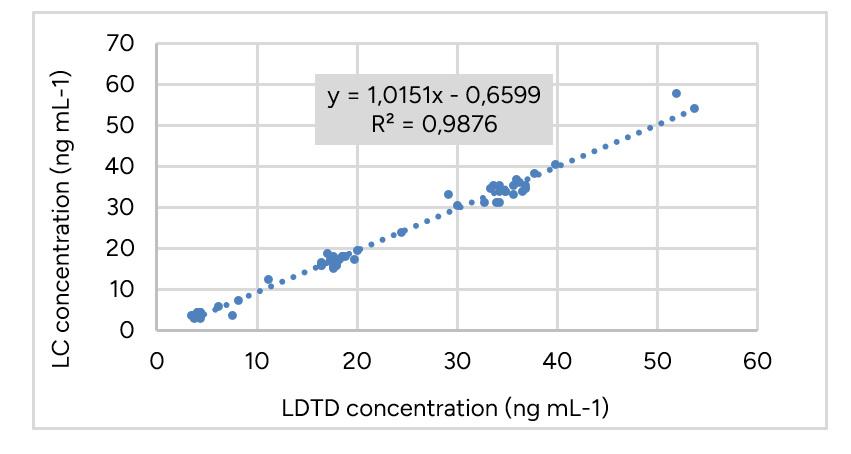
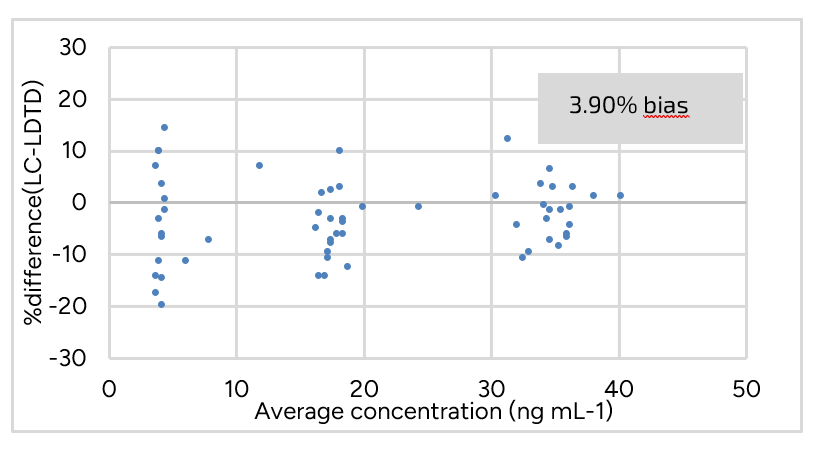
Correlation plots between concentrations obtained for real samples using both LDTD-MS/MS and LC-MS/MS methods were drawn to evaluate r2 values. All correlation plots exceeded 0.97 r2 values. Bland-Altman plots are graphical representations of the method agreement between LC and LDTD. Evenly scattered points on the y-axis indicate that the methods agree while the contrary would indicate that one method constantly under or over-evaluates drug concentration. Bland-Altman plots show that the average percent difference between both methods remained below 5% for all drugs, suggesting that neither method is biased towards under or over-evaluating the drug concentration of a sample. Tacrolimus results are showed in Figure 3 and Figure 4. Similar results are obtained for the other drugs.
Conclusion
Luxon Ion Source® combined to Sciex Q-Trap 5500 mass spectrometer system allows ultra-fast (9 seconds per sample) analysis of immunosuppressive drugs in whole blood using a simple and automated sample preparation method.