Introduction
The American Academy of Neurology and American Epilepsy Society’s (AANAES) guidelines suggest using either standard anticonvulsants drugs such as carbamazepine or phenobarbital, or the newer anticonvulsants drugs gabapentin, lamotrigine, oxcarbazepine or topiramate for patients with newly diagnosed epilepsy.
Therapeutic Drug Monitoring (TDM), after starting a treatment, helps in establishing a baseline, steady-state concentration for further evaluation of an individual therapeutic concentration. It can be useful, for instance, after a change in drug dosage, in particular when non-linear kinetics apply; at a therapeutic failure, to seek a pharmacokinetic explanation for uncontrolled seizures or side effects; in case of drug interaction; when pharmacokinetics changes due to physiological or pathological changes are foreseen (e.g., age-dependent conditions, pregnancy, hepatic disease, renal disease or gastrointestinal conditions potentially affecting drug absorption); or, following changes in drug formulations (brand name/generic).
Our goal for this application note is to use a protein precipitation method for the analysis of different antiepileptic drugs (10-OH-Carbamazepine, Oxacarbazepin, Lamotrigine, Levetiracetam, Gabapentin, Topiramate, Primidone and Phenobarbital). A single analysis method using Luxon-MS/MS allows quantification of all compounds at 8 seconds per sample.
Luxon-MS/MS offers specificity combined with an ultra-fast analysis for an unrivaled analysis method. To develop this application, we focused on performing a quick and simple preparation method. Eight (8) antiepileptic drugs are analyzed simultaneously with quantitative results (within the therapeutic range) obtained in less than 8 seconds per sample.
Luxon Ionization Source
The Luxon Ion Source® (Figure 1) is the second-generation sample introduction and ionization source based on the LDTD® technology for mass spectrometry. Luxon Ion Source® uses Fiber-Coupled Laser Diode (Figure 2) to obtain unmatchable thermal uniformity giving more precision, accuracy and speed. The process begins with dry samples which are rapidly evaporated using indirect heat. The thermally desorbed neutral molecules are carried into a corona discharge region. High-efficiency protonation and strong resistance to ionic suppression characterize this type of ionization and it is the result of the absence of solvent and mobile phase. This thermal desorption process yields high-intensity molecular ion signal in less than 1 second sample-to-sample and allows working with very small volumes.
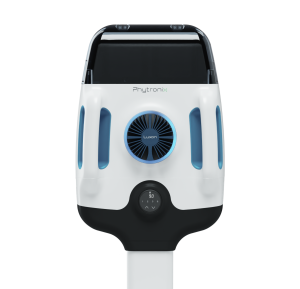
Figure 1 – Luxon Ion Source®
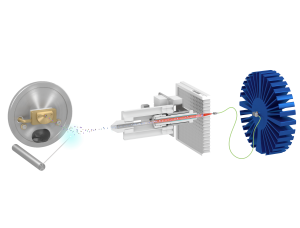
Figure 2 – Schematic of the Luxon Ionization Source
Sample Preparation Method
- 10 µL plasma sample.
- 120 µL internal standard (Gabapentin-d10, Methadone-d9 and Phenobarbital-d5, 1 µg/mL, 50 ng/mL and 200 ng/mL in acetonitrile).
- Vortex.
- Centrifuge 14,000 rpm / 2min.
- Spot 3 µL upper-layer phase on a LazWell™96 AD plate.
- Dry 2 minute at room temperature with air flow.
Table 1 shows the therapeutic range reported in literature and the calibration range used for the quantification.
| Drug | Therapeutic range | Calibration range |
|---|---|---|
| 10-OH-Carbamazepine | 3-40 µg/mL | 0.5-50 µg/mL |
| Oxcarbazepine | 0,4-2 µg/mL | 0.1-10 µg/mL |
| Lamotrigine | 3-14 µg/mL | 0.3-30 µg/mL |
| Levetiracetam | 10-43 µg/mL | 0.5-50 µg/mL |
| Gabapentin | 2-20 µg/mL | 0.25-25 µg/mL |
| Topiramate | 5-25 µg/mL | 0.5-50 µg/mL |
| Primidone | 5-15 µg/mL | 0.25-25 µg/mL |
| Phenobarbital | 10-40 µg/mL | 0.5-50 µg/mL |
Luxon-MS/MS Parameters
Luxon
Model: Luxon SH-960, Phytronix
Carrier gas: 3 L/min (air)
Laser pattern:
- 6-second ramp to 45% power
- Hold 2 seconds at 45% power
MS/MS
MS model: Shimadzu: LC-8060
Scan Time: 10 msec
Total run time: 8 seconds per sample
Ionization: APCI
Analysis Method: MRM mode
| Drug | Transition | CE | Mode |
|---|---|---|---|
| Levetiracetam | 171 🡪 126 | 16 | Positive |
| Gabapentin | 172 🡪 137 | 12 | Positive |
| Gabapentin-d10 | 182 🡪 147 | 12 | Positive |
| Primidone | 219 🡪 162 | 30 | Positive |
| Oxcarbazepin | 253 🡪 208 | 30 | Positive |
| 10-OH-Carbamazepin | 255 🡪 194 | 50 | Positive |
| Lamotrigine | 256 🡪 157 | 30 | Positive |
| Methadone-d9 | 319 🡪 268 | 16 | Positive |
| Topiramate | 340 🡪 264 | 10 | Positive |
| Phenobarbital | 231 🡪 42 | 25 | Negative |
| Phenobarbital-d5 | 236 🡪 42 | 25 | Negative |
Results and Discussion
Linearity
Plasma is spiked with drugs to prepare standards within a calibration range described in Table 1. Standards are extracted and used to generate a calibration curve. Table 3 shows the calibration curve results. Correlation values greater than 0.99 are obtained for all drugs. Figure 3 shows typical calibration curve results for Gabapentin.
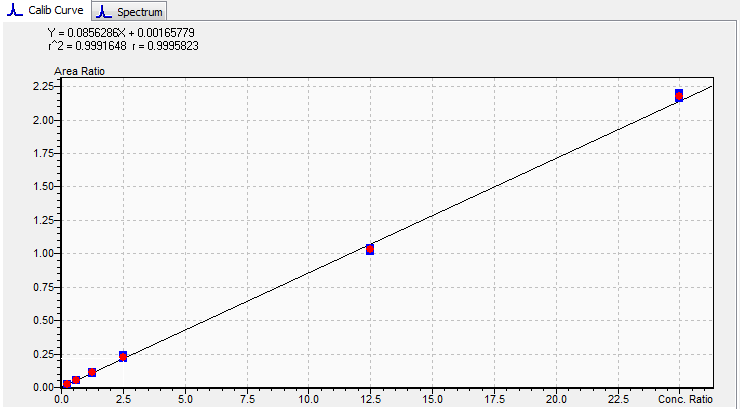
Figure 3 – Standard Curve for Gabapentin
| Drug | m | b | r2 |
|---|---|---|---|
| Levetiracetam | 1.49349 | -0.05739 | 0.99986 |
| Gabapentin | 0.08563 | 0.00166 | 0.99916 |
| Primidone | 0.23423 | -0.00228 | 0.99718 |
| Oxcarbazepin | 0.18356 | 0.00103 | 0.99672 |
| 10-OH-Carbamazepin | 0.01544 | 0.00096 | 0.99734 |
| Lamotrigine | 0.02184 | 0.00189 | 0.99956 |
| Topiramate | 1.41118 | 0.02310 | 0.99788 |
| Phenobarbital | 0.60101 | -0.02828 | 0.99959 |
Accuracy and Precision
Calibration curves are extracted and analyzed. For the intra-run precision and accuracy experiment, each fortified sample sets are analyzed in triplicate. Table 4 show the intra-run result for Gabapentin. Each concentration is not exceeding 15% CV and the mean concentration are within ±15% of expected value. Similar results are obtained for the other drugs.
| STD 1 | STD 2 | STD 3 | STD 4 | STD 5 | STD 6 | |
|---|---|---|---|---|---|---|
| Exp. conc.(µg/mL) | 0.25 | 0.625 | 1.25 | 2.5 | 12.5 | 25 |
| Calc. conc (µg/mL) | 0.253 | 0.607 | 1.260 | 2.577 | 11.995 | 25.432 |
| N | 3 | 3 | 3 | 3 | 3 | 3 |
| %CV | 9.3 | 2.7 | 4.4 | 5.6 | 1.1 | 0.7 |
| %Nom | 101.2 | 97.1 | 100.8 | 103.1 | 96.0 | 101.7 |
Matrix effect evaluation
Drugs are spiked in six (6) different plasma matrices and at concentrations are evaluated against a calibration curve. Replicate extractions are deposited on a LazWell™ plate and dried before analysis. The peak area against the internal standard (IS) ratio was used to normalize the signal. The following criteria are used: Calculated concentration must not exceed 15% CV and the mean concentration must be within 15% of nominal value.
Results for all drugs are shown in Table 5 where we see that each concentration does exceeding 15% CV and the mean concentration is within ±15% of expected value.
| 10-OH-Carbamazepin | M 1 | M 2 | M 3 | M 4 | M 5 | M 6 |
|---|---|---|---|---|---|---|
| Exp. conc.(µg/mL) | 5,5 | 5,5 | 5,5 | 5,5 | 5,5 | 5,5 |
| Calc. conc (µg/mL) | 5,88 | 5,58 | 5,56 | 6,27 | 5,22 | 5,77 |
| N | 4 | 4 | 4 | 4 | 4 | 4 |
| %CV | 7,5 | 7,2 | 6,7 | 5,7 | 6,2 | 4,9 |
| %Nom | 106,9 | 101,5 | 101,1 | 114,1 | 95,0 | 104,9 |
| Oxcarbazepin | M 1 | M 2 | M 3 | M 4 | M 5 | M 6 |
|---|---|---|---|---|---|---|
| Exp. conc.(µg/mL) | 1 | 1 | 1 | 1 | 1 | 1 |
| Calc. conc (µg/mL) | 1,10 | 1,02 | 1,08 | 1,15 | 0,98 | 1,06 |
| N | 4 | 4 | 4 | 4 | 4 | 4 |
| %CV | 4,7 | 2,1 | 4,9 | 1,1 | 6,3 | 2,7 |
| %Nom | 110,0 | 101,7 | 108,0 | 115,0 | 98,1 | 106,1 |
| Lamotrigine | M 1 | M 2 | M 3 | M 4 | M 5 | M 6 |
|---|---|---|---|---|---|---|
| Exp. conc.(µg/mL) | 1,2 | 1,2 | 1,2 | 1,2 | 1,2 | 1,2 |
| Calc. conc (µg/mL) | 1,23 | 1,09 | 1,02 | 1,17 | 1,32 | 1,21 |
| N | 4 | 4 | 4 | 4 | 4 | 4 |
| %CV | 3,7 | 2,2 | 5,1 | 3,8 | 6,0 | 3,8 |
| %Nom | 102,6 | 90,9 | 85,0 | 97,4 | 109,6 | 101,1 |
| Levetiracetam | M 1 | M 2 | M 3 | M 4 | M 5 | M 6 |
|---|---|---|---|---|---|---|
| Exp. conc.(µg/mL) | 1 | 1 | 1 | 1 | 1 | 1 |
| Calc. conc (µg/mL) | 1,08 | 0,97 | 0,99 | 1,00 | 0,94 | 0,98 |
| N | 4 | 4 | 4 | 4 | 4 | 4 |
| %CV | 4,3 | 4,5 | 1,9 | 3,2 | 8,4 | 3,2 |
| %Nom | 107,7 | 96,6 | 99,4 | 99,8 | 94,2 | 98,1 |
| Gabapentin | M 1 | M 2 | M 3 | M 4 | M 5 | M 6 |
|---|---|---|---|---|---|---|
| Exp. conc.(µg/mL) | 2,5 | 2,5 | 2,5 | 2,5 | 2,5 | 2,5 |
| Calc. conc (µg/mL) | 2,42 | 2,47 | 2,44 | 2,53 | 2,56 | 2,63 |
| N | 4 | 4 | 4 | 4 | 4 | 4 |
| %CV | 0,2 | 1,9 | 2,9 | 2,8 | 2,4 | 7,2 |
| %Nom | 96,6 | 98,7 | 97,4 | 101,1 | 102,5 | 105,2 |
| Topiramate | M 1 | M 2 | M 3 | M 4 | M 5 | M 6 |
|---|---|---|---|---|---|---|
| Exp. conc.(µg/mL) | 1,2 | 1,2 | 1,2 | 1,2 | 1,2 | 1,2 |
| Calc. conc (µg/mL) | 1,21 | 1,21 | 1,07 | 1,07 | 1,25 | 1,16 |
| N | 4 | 4 | 4 | 4 | 4 | 4 |
| %CV | 11,8 | 7,8 | 6,4 | 2,7 | 10,4 | 2,2 |
| %Nom | 100,7 | 101,0 | 89,5 | 89,4 | 104,0 | 96,4 |
| Primidone | M 1 | M 2 | M 3 | M 4 | M 5 | M 6 |
|---|---|---|---|---|---|---|
| Exp. conc.(µg/mL) | 2,5 | 2,5 | 2,5 | 2,5 | 2,5 | 2,5 |
| Calc. conc (µg/mL) | 2,59 | 2,40 | 2,38 | 2,76 | 2,34 | 2,49 |
| N | 4 | 4 | 4 | 4 | 4 | 4 |
| %CV | 5,4 | 4,8 | 9,4 | 6,1 | 7,3 | 5,2 |
| %Nom | 103,5 | 95,9 | 95,2 | 110,3 | 93,7 | 99,6 |
| Phenobarbital | M 1 | M 2 | M 3 | M 4 | M 5 | M 6 |
|---|---|---|---|---|---|---|
| Exp. conc.(µg/mL) | 5 | 5 | 5 | 5 | 5 | 5 |
| Calc. conc (µg/mL) | 4,80 | 4,92 | 4,91 | 5,10 | 5,08 | 5,04 |
| N | 4 | 4 | 4 | 4 | 4 | 4 |
| %CV | 1,0 | 1,2 | 0,4 | 0,9 | 0,9 | 0,8 |
| %Nom | 95,9 | 98,4 | 98,3 | 101,9 | 101,7 | 100,8 |
Conclusion
Luxon Ion Source® combined to Shimadzu 8060 mass spectrometer system allows ultra-fast (8 seconds per sample) quantification of antiepileptic drugs in plasma sample using a simple generic sample preparation method.