Introduction
Vitamin K1 (phylloquinone) is an essential compound involved in the synthesis of several blood coagulation factors, bone metabolism, and the prevention of vascular calcification. Therapeutic monitoring, particularly in patients on anticoagulants, is crucial for optimizing treatment and ensuring effective care.
Our goal for this application is to use a combination of efficient sample preparation for the quantification of vitamin K1 in serum using the Luxon Ion Source®, based on LDTD technology.
LDTD-MS/MS offers specificity combined with an ultra-fast analysis for an unrivaled quantification method. To develop this application, we focused on performing efficient sample preparation. Vitamin K1 is analyzed, and results are obtained in less than 10 seconds per sample.
Luxon Ionization Source
The Luxon Ion Source (Figure 1) is the second-generation sample introduction and ionization source based on the LDTD technology for mass spectrometry. Luxon Ion Source uses Fiber-Coupled Laser Diode (Figure 2) to obtain unmatchable thermal uniformity providing more precision, accuracy, and speed. The process begins with dry samples which are rapidly evaporated using indirect heat. The thermally desorbed neutral molecules are carried into a corona discharge region. High efficiency protonation and strong resistance to ionic saturation characterize this type of ionization and is the result of the absence of solvent and mobile phase. This thermal desorption process yields high-intensity molecular ion signal in less than 1 second sample-to-sample and allows working with very small volumes.
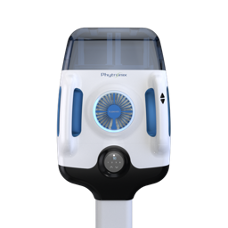
Figure 1 – Luxon Ion Source®

Figure 2 – Schematic of the Luxon Ionization Source
Sample Preparation Method
Due to the instability of vitamin K1, stock solutions were prepared in ethanol (0.01% BHT). Pooled serum was exposed to UV light for at least 24h due to photodegradation of endogenous vitamin K. The pooled exposed serum was then spiked to generate a calibration curve.
- 5 µL of working standard solution (10X) is added to a micro-centrifugation tube of 0.5 mL.
- 5 µL of Internal standard (Phylloquinone-D7, 100 ng/mL in EtOH (0.01% BHT) were added to each sample.
- Mix 10 seconds at 1100 RPM.
- 50 µL of serum sample or negative matrix for calibration curve.
- Mix 10 seconds at 1100 RPM.
- 400 µL of isopropanol (IPA) were added.
- Mix 30 seconds at 1100 RPM.
- Transfer 200 µL of upper layer into a 10 X 75 mm borosilicate tube.
- Evaporate to dryness (0.5 PSI at 40°C for 15 minutes).
- Reconstitute with 200 µL of Hexane.
- Mix 10 seconds at 1100 RPM.
- Transfer 100 µL of upper layer into a 6 X 31 mm borosilicate tube.
- Evaporate to dryness (10 LPM at40°C for 5 minutes).
- Reconstitute with 100 µL of a mixture of isopropanol/water (80/20).
- Mix 10 seconds at 1100 RPM.
- Spot 5 µL of mixture onto a LazWell™ 96 plate.
- Dry 3 minutes at 40°C.
LDTD®-MS/MS Parameters
LDTD
Model: Luxon SH-960, Phytronix
Carrier gas: 9 L/min
Laser pattern:
- 9-second ramp to 45% power*
*Note: Power must be optimized with each instrument
MS/MS
MS model: Triple Quadrupole LCMS-8060, Shimadzu
DL Temperature: 250°C
Heat Block Temperature: 250°C
Voltage: 3500 V
Dwell Time: 10 msec
Total run time: 10 seconds per sample
Analysis Method: Negative MRM mode
Table 1 – MRM transitions for LDTD-MS/MS
| Transition | CE | |
| Phylloquinone (Vitamin K1) | 450.34 185.17 | 40 |
| Phylloquinone-d7 (Vitamin K1-d7) | 457.40 192.17 | 40 |
Results and Discussion
Validation Test
Calibration curves ranging from 250 to 5000 pg/mL were prepared in a photodegraded human serum. Replicate extractions were deposited onto a LazWell™ plate and dried before analysis. The peak area against the internal standard (IS) ratio was used to normalize the signal.
Linearity
The calibration curves were plotted using the peak area ratio and the nominal concentration of standards. For the linearity test, the following acceptance criteria was used:
- Linear regression (determination coefficient, r2) must be ≥ 99
Table 2 shows the inter-day correlation coefficients for Vitamin K1. Determination coefficient (r2) values greater than 0.99 are obtained. Figure 3 shows a typical calibration curve result for Vitamin K.
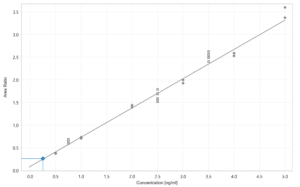
Figure 3 – Vitamin K1 calibration curve
Table 2 – Inter-day calibration curve correlation coefficients (r2)
| Vitamin K1 | |
| Curve 1 | 0.99389 |
| Curve 2 | 0.99425 |
| Curve 3 | 0.99481 |
| Curve 4 | 0.99018 |
| Curve 5 | 0.99553 |
Precision and Accuracy
For the accuracy and precision evaluation, the following acceptance criteria were used:
- Each concentration must not exceed 15% CV
- Each concentration must be within 100 ± 15% of the nominal concentration
For the intra and inter-run precision and accuracy experiment, each QC was analyzed in sextuplicate, on five different days. Table 3 and 4 shows the intra and inter-run precision and accuracy results for Vitamin K1. The obtained %CV was below 15% and the accuracy was within 15% of the nominal value.
Table 3 – Intra-Run Precision and Accuracy of Vitamin K1
| Vitamin K1 | LLOQ | QC-L | QC-M | QC-H | ULQC |
| Conc (pg/mL) | 250 | 750 | 2500 | 3500 | 5000 |
| N | 6 | 6 | 6 | 6 | 6 |
| Mean (pg/mL) | 278 | 722 | 2483 | 3578 | 5035 |
| %CV | 4.5 | 7.1 | 6.6 | 5.2 | 6.4 |
| %Bias | 11.0 | 3.8 | 0.7 | 2.2 | 0.7 |
Table 4 – Inter-Run Precision and Accuracy of Vitamin K1
| Vitamin K1 | QC-L | QC-M | QC-H |
| Conc (pg/mL) | 750 | 2500 | 3500 |
| N | 36 | 36 | 36 |
| Mean (pg/mL) | 722 | 2488 | 3439 |
| %CV | 11.8 | 8.6 | 8.0 |
| %Bias | 3.5 | 0.5 | 1.8 |
Wet Stability of Sample Extracts
Following the extraction, sample extracts are kept at 4°C in closed containers protected from light. After 24 hours, sample extracts are spotted on a LazWell™ plate, dried and analyzed. Precision and accuracy of QC samples are reported in Figure 4. All the results are within the acceptable criteria range for 24 hours at 4°C.
Dry Stability of Samples Spotted in LazWell™
Extracted samples are spotted onto a LazWell™ plate, dried and kept at room temperature for 1 hour before analysis. The precision and accuracy results of QC samples are reported in Figure 4. All the results are within the acceptable criteria range for 1 hour at room temperature.
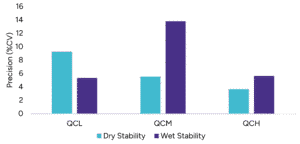
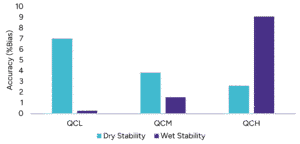
Figure 4 – Wet and Dry Stability of Vitamin K1
Cross validation study
Real patients’ serum samples (N=8) have been tested with this method to correlate with results obtained by traditional LC-MS/MS. The percentage of difference between the values are evaluated. A difference below 20% is obtained. Results are reported in Table 5.
Table 5 – Comparison between Vitamin K1 concentration values
| Vitamin K1 | LC
(pg/mL) |
Luxon
(pg/mL) |
%Diff
(%) |
| M1 | 2562 | 2600 | -1.5 |
| M2 | 3310 | 3150 | 4.8 |
| M3 | 3719 | 3205 | 13.8 |
| M4 | 3208 | 2955 | 7.9 |
| M5 | 2707 | 2285 | 15.6 |
| M6 | 2846 | 3145 | -10.5 |
| M7 | 3081 | 3490 | -13.3 |
| M8 | 2965 | 2840 | 4.2 |
Conclusion
The Luxon Ion Source® combined with Shimadzu Triple Quadrupole LCMS-8060 mass spectrometer system allows the ultra-fast (10 seconds per sample) analysis of Vitamin K1 in serum.