Introduction
Vitamin B3 (Nicotinamide) and B5 (Pantothenic acid) have important roles in physiological functions to maintain good health. Scientific publications report their potential implication in treatments for depression1. Their role as biomarkers is evaluated. For large epidemiologic studies, high-throughput and accurate analytical techniques are needed.
Our goal for this application note is to use an automated sample preparation method for the quantification of Vitamin B3 and B5 in plasma using a single operation in LDTD-MS/MS.
LDTD-MS/MS offers specificity combined with an ultra-fast analysis for an unrivaled quantification method. To develop this application, we focused on performing a quick and simple sample preparation. Vitamin B3 and B5 are analyzed, and results are obtained in less than 9 seconds per sample.
Luxon Ionization Source
The Luxon Ion Source® (Figure 1) is the second-generation sample introduction and ionization source based on the LDTD® technology for mass spectrometry. Luxon Ion Source® uses Fiber-Coupled Laser Diode (Figure 2) to obtain unmatchable thermal uniformity providing more precision, accuracy, and speed. The process begins with dry samples which are rapidly evaporated using indirect heat. The thermally desorbed neutral molecules are carried into a corona discharge region. High efficiency protonation and strong resistance to ionic saturation characterize this type of ionization and is the result of the absence of solvent and mobile phase. This thermal desorption process yields high-intensity molecular ion signal in less than 1 second sample-to-sample and allows working with very small volumes.
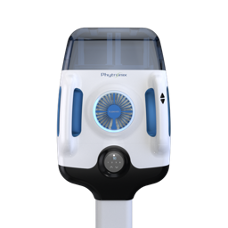
Figure 1 – Luxon Ion Source®

Figure 2 – Schematic of the Luxon Ionization Source
Sample Preparation Method
Automated Sample Extraction
Vitamin B3 and B5, stock solutions were prepared in methanol. Bovine serum albumin (BSA) at 10 mg/mL was used as a negative matrix then spiked to generate a calibration curve.
Plasma samples were transferred into barcoded tubes, readable by the Azeo extraction system. Each barcoded vial was scanned by the Azeo Liquid Handler and an automatic batch file was created.
The Azeo Liquid Handler (Erreur! Source du renvoi introuvable.) is used to extract the samples using the following conditions:
- 80 µL of Internal standard (Nicotinamide-13C6 and Pantothenic acid-13C315N at 100 ng/mL and 400 ng/mL in methanol:Water (1:1) were added to a deep-well plate placed on the Lumo Vortexer.
- 80 µL of plasma sample were transferred from the vials to a deep-well plate placed on the Lumo Vortexer.
- Mix (30 seconds at 1000 rpm).
- 240 µL of acetonitrile were added into a deep-well plate.
- Mix (30 seconds at 1000 rpm).
- Centrifugation at 5000 rpm for 2 minutes for phase separation.
- 50 µL of upper layer phase were transferred into a second deep-well plate.
- 50 µL of KH2PO4 (4 mM)
- 500 µL Hexane:MTBE (1:1) were added into a deep-well plate
- Mix (30 seconds at 1000 rpm).
- Centrifugation at 5000 rpm for 2 minutes for phase separation.
- Spot 4 µL lower layer phase onto a LazWell™ 96 plate.
- Dry 5 minute at 40°C.
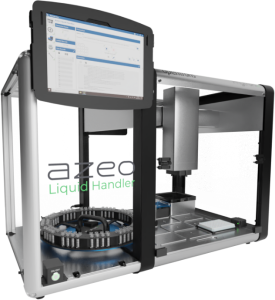
Figure 3 – Automated extraction system.
LDTD®-MS/MS Parameters
LDTD
Model: Luxon SH-960, Phytronix
Carrier gas: 9 L/min (air)
Laser pattern:
- 6-second ramp to 85% power
- Hold 3 seconds.
MS/MS
MS model: LCMS-8060, Shimadzu
Scan Time: 20 msec.
Total run time: 9 seconds per sample
Ionization: APCI
Analysis Method: Positive MRM mode
Table 1 – MRM transitions for LDTD-MS/MS
| Transition | CE | |
|---|---|---|
| Nicotinamide | 123 → 80 | 25 |
| Nicotinamide-13C6 | 129 → 85 | 25 |
| Pantothenic acid | 220 → 90 | 15 |
| Pantothenic acid-13C315N | 224 → 94 | 15 |
Results and Discussion
Data preparation process
Mass spectrometers are data acquisition systems that were not designed to deal with signals of a few seconds per sample. The synchronization sequence adds 6 to more than 15 seconds between each sample. To bypass this delay, all samples are acquired in a single file (Figure 1). To allow the analysis of such data, Cascade software is designed to detect, split, and integrate every sample peak acquired in a single file.
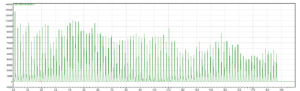
Figure 4 – Single file mass spectrometer data for 96 samples. Pantothenic acid-13C3 15N transition.
Validation Test
Calibration curves ranging from 10 to 1000 ng/mL for Vitamin B3 and B5 were prepared in BSA (10 mg/mL). Replicate extractions were deposited onto a LazWell™ plate and dried before analysis. The peak area against the internal standard (IS) ratio was used to normalize the signal.
Linearity
The calibration curves were plotted using the peak area ratio and the nominal concentration of standards. For the linearity test, the following acceptance criteria was used:
- Linear regression (r2) must be ≥ 99
Figure 5 shows a typical calibration curve result for Vitamin B3 (A) with a coefficient of determination (r2) of 0.99794 and Vitamin B5 (B) with a r2 of 0.99825.
| A
|
B
|
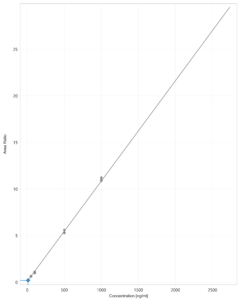
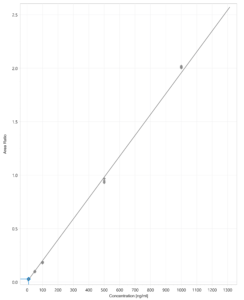
Figure 5 – Vitamin B3 (A) and Vitamin B5 (B) calibration curve.
Precision and Accuracy
For the accuracy and precision evaluation, the following acceptance criteria were used:
- Each concentration must not exceed 20% CV.
- Each concentration must be within 100 ± 20% of the nominal concentration.
For the inter-run precision and accuracy experiment, each standard was analyzed in triplicate in six different runs. Table 2 and 3 show the inter-run precision and accuracy results for Vitamin B3 and B5, respectively. The obtained %CV was below 15% and the accuracy was within 15% of the nominal value.
Table 2 – Inter-Run Precision and Accuracy of Vitamin B3
| Vitamin B3 | Cal-1 | Cal-2 | Cal-3 | Cal-4 | Cal-5 |
| Conc (ng/ml) | 10 | 50 | 100 | 500 | 1000 |
| N | 18 | 18 | 18 | 18 | 18 |
| Mean (ng/ml) | 10.9 | 49.8 | 94.7 | 465.4 | 1039.3 |
| %CV | 10.2 | 11.8 | 7.5 | 5.7 | 4.3 |
| %Nom | 108.8 | 99.5 | 94.7 | 93.1 | 103.9 |
Table 3 – Inter-Run Precision and Accuracy of Vitamin B5
| Vitamin B5 | Cal-1 | Cal-2 | Cal-3 | Cal-4 | Cal-5 |
| Conc (ng/ml) | 10 | 50 | 100 | 500 | 1000 |
| N | 18 | 18 | 18 | 18 | 18 |
| Mean (ng/ml) | 10.8 | 47.4 | 98.4 | 468.1 | 1039.7 |
| %CV | 7.3 | 6.8 | 5.3 | 3.3 | 2.7 |
| %Nom | 107.6 | 94.8 | 98.4 | 93.6 | 104.0 |
Stability
Wet stability: Following the extraction, the extracted sample was kept at room temperature in closed containers. After 1 day, extracted samples are spotted on a LazWell™ plate, dried and analyzed. Precision and accuracy are reported in Table 3. All the results are within the acceptable criteria range for 1 day at room temperature.
Dry stability: Extracted samples are spotted onto a LazWell™ plate, dried and kept at room temperature for 1 hour before analysis. The precision and accuracy results are reported in Table 3. All the results are within the acceptable criteria range for 1 hour at room temperature.
Table 4 – Wet and Dry Stability of Vitamin B3 and B5
| Vitamin B3 | Wet stability (1 day / RT) | Dry stability (1 hour / RT) | ||||
| Cal 1 | Cal 3 | Cal 5 | Cal 1 | Cal 3 | Cal 5 | |
| Conc. (ng/mL) | 10 | 100 | 1000 | 10 | 100 | 1000 |
| N | 3 | 3 | 3 | 3 | 3 | 3 |
| Mean (ng/mL) | 10.9 | 91.0 | 1016.7 | 10.7 | 90.0 | 1024.1 |
| %CV | 4.5 | 8.4 | 2.0 | 7.5 | 2.6 | 5.8 |
| %Nom | 109.2 | 91.0 | 101.7 | 106.5 | 90.0 | 102.4 |
| Vitamin B5 | Wet stability (1 day / RT) | Dry stability (1 hour / RT) | ||||
| Cal 1 | Cal 3 | Cal 5 | Cal 1 | Cal 3 | Cal 5 | |
| Conc. (ng/mL) | 10 | 100 | 1000 | 10 | 100 | 1000 |
| N | 3 | 3 | 3 | 3 | 3 | 3 |
| Mean (ng/mL) | 10.7 | 93.9 | 1020.8 | 10.9 | 93.5 | 1015.0 |
| %CV | 15.9 | 1.6 | 0.8 | 8.4 | 0.7 | 0.6 |
| %Nom | 107.2 | 93.9 | 102.1 | 108.9 | 93.5 | 101.5 |
Cross validation study
Real patients’ serum samples (N=6) have been tested with this method to correlate with results obtained by traditional LC-MS/MS. The percentage of difference between the values are evaluated. A difference below 20% is obtained. Results are reported in Table 5.
Table 5– Cross validation results
| Vitamin B3 | Vitamin B5 | ||||||
| LC
(ng/mL) |
Luxon
(ng/mL) |
%Diff
(%) |
LC
(ng/mL) |
Luxon
(ng/mL) |
%Diff
(%) |
||
| M1 | 9.1 | 14.9 | 12.1 | 55.2 | 55.9 | 0.3 | |
| M2 | 18.3 | 24.0 | 6.7 | 61.7 | 67.6 | 1.1 | |
| M3 | 55.1 | 54.9 | -0.1 | 97.4 | 96.5 | -0.2 | |
| M4 | 106.2 | 96.6 | -2.4 | 143.9 | 139.2 | -0.8 | |
Conclusion
The Luxon Ion Source® combined with Shimadzu LCMS-8060 mass spectrometer system allows ultra-fast (9 seconds per sample) analysis of Vitamin B3 and B5 in plasma.
References
- Ryan et Al. (2020). Brain, Behavior & Immunity – Health 4, 100063